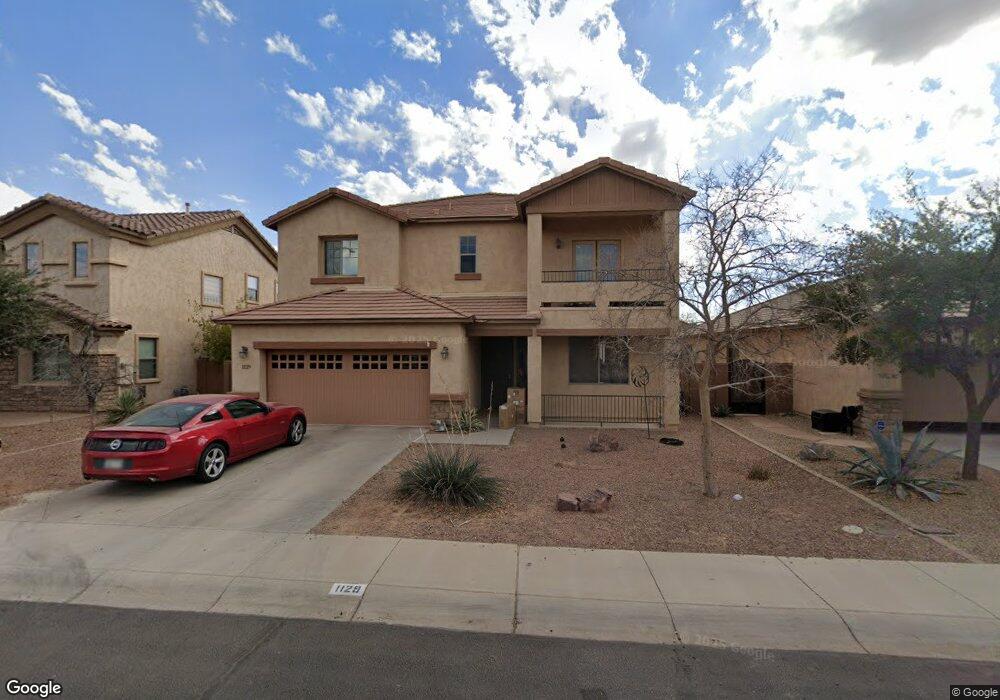
1129 E Gabrilla Dr Casa Grande, AZ 85122
Estimated Value: $342,355 - $438,000
4
Beds
3
Baths
2,877
Sq Ft
$139/Sq Ft
Est. Value
About This Home
This home is located at 1129 E Gabrilla Dr, Casa Grande, AZ 85122 and is currently estimated at $400,589, approximately $139 per square foot. 1129 E Gabrilla Dr is a home located in Pinal County with nearby schools including Ironwood School, Cactus Middle School, and Legacy Traditional School - Casa Grande.
Ownership History
Date
Name
Owned For
Owner Type
Purchase Details
Closed on
Aug 7, 2025
Sold by
Clarke Roger Eric
Bought by
Clark April
Current Estimated Value
Purchase Details
Closed on
Feb 21, 2018
Sold by
Uspg Cottonwood Llc
Bought by
Forestar Usa Real Estate Group Inc
Purchase Details
Closed on
Jan 14, 2011
Sold by
Smith Kimberl Lee
Bought by
Clarke Roger E
Home Financials for this Owner
Home Financials are based on the most recent Mortgage that was taken out on this home.
Original Mortgage
$145,053
Interest Rate
4.79%
Mortgage Type
VA
Purchase Details
Closed on
Dec 28, 2010
Sold by
Washington Federal Savings
Bought by
Clarke Roger E
Home Financials for this Owner
Home Financials are based on the most recent Mortgage that was taken out on this home.
Original Mortgage
$145,053
Interest Rate
4.79%
Mortgage Type
VA
Purchase Details
Closed on
Dec 3, 2009
Sold by
B Alan Cottonwood Llc
Bought by
Washington Federal Savings
Create a Home Valuation Report for This Property
The Home Valuation Report is an in-depth analysis detailing your home's value as well as a comparison with similar homes in the area
Home Values in the Area
Average Home Value in this Area
Purchase History
| Date | Buyer | Sale Price | Title Company |
|---|---|---|---|
| Clark April | -- | None Listed On Document | |
| Forestar Usa Real Estate Group Inc | $2,587,500 | Dhi Title | |
| Clarke Roger E | -- | First American Title Ins Co | |
| Clarke Roger E | $142,000 | First American Title Ins Co | |
| Washington Federal Savings | -- | Security Title Agency |
Source: Public Records
Mortgage History
| Date | Status | Borrower | Loan Amount |
|---|---|---|---|
| Previous Owner | Clarke Roger E | $145,053 |
Source: Public Records
Tax History Compared to Growth
Tax History
| Year | Tax Paid | Tax Assessment Tax Assessment Total Assessment is a certain percentage of the fair market value that is determined by local assessors to be the total taxable value of land and additions on the property. | Land | Improvement |
|---|---|---|---|---|
| 2025 | $2,127 | $30,856 | -- | -- |
| 2024 | $2,148 | $37,091 | -- | -- |
| 2023 | $2,180 | $28,705 | $2,788 | $25,917 |
| 2022 | $2,148 | $21,220 | $2,788 | $18,432 |
| 2021 | $2,281 | $20,160 | $0 | $0 |
| 2020 | $2,153 | $18,862 | $0 | $0 |
| 2019 | $2,043 | $17,861 | $0 | $0 |
| 2018 | $2,022 | $17,367 | $0 | $0 |
| 2017 | $1,963 | $17,735 | $0 | $0 |
| 2016 | $1,872 | $17,634 | $2,125 | $15,509 |
| 2014 | $1,663 | $12,237 | $1,000 | $11,237 |
Source: Public Records
Map
Nearby Homes
- 1130 E Palm Parke Blvd
- 1134 E Palm Parke Blvd
- 1121 E Jahns Dr
- 1808 N Menze Ln
- 1841 N Briarcliff Rd Unit 3
- 1268 E Jahns Dr
- 1212 E Palo Verde Dr
- 1241 E Palo Verde Dr
- 1175 E Prickly Pear St
- 1028 N Brown Ave Unit 18
- 1944 N Avenida de Palmas
- 1706 N Hubbard St
- 1959 N Vista Ln
- 1170 E Jardin Dr
- 1741 E Palm Parke Blvd
- 1173 E Kingman St
- 1255 E Lee Place
- 602 E Judi Dr
- 1327 E Judi Dr
- 612 E Racine Place
- 1125 E Gabrilla Dr
- 1133 E Gabrilla Dr
- 1137 E Gabrilla Dr
- 1121 E Gabrilla Dr
- 1130 E Viola Ct
- 1126 E Viola Ct
- 1134 E Viola Ct
- 1141 E Gabrilla Dr
- 1138 E Viola Ct
- 1128 E Gabrilla Dr
- 1122 E Viola Ct
- 1132 E Gabrilla Dr
- 1124 E Gabrilla Dr
- 1136 E Gabrilla Dr
- 1120 E Gabrilla Dr
- 1142 E Viola Ct
- 1145 E Gabrilla Dr
- 1140 E Gabrilla Dr
- 1775 N Mandeville Ln
- 1779 N Mandeville Ln