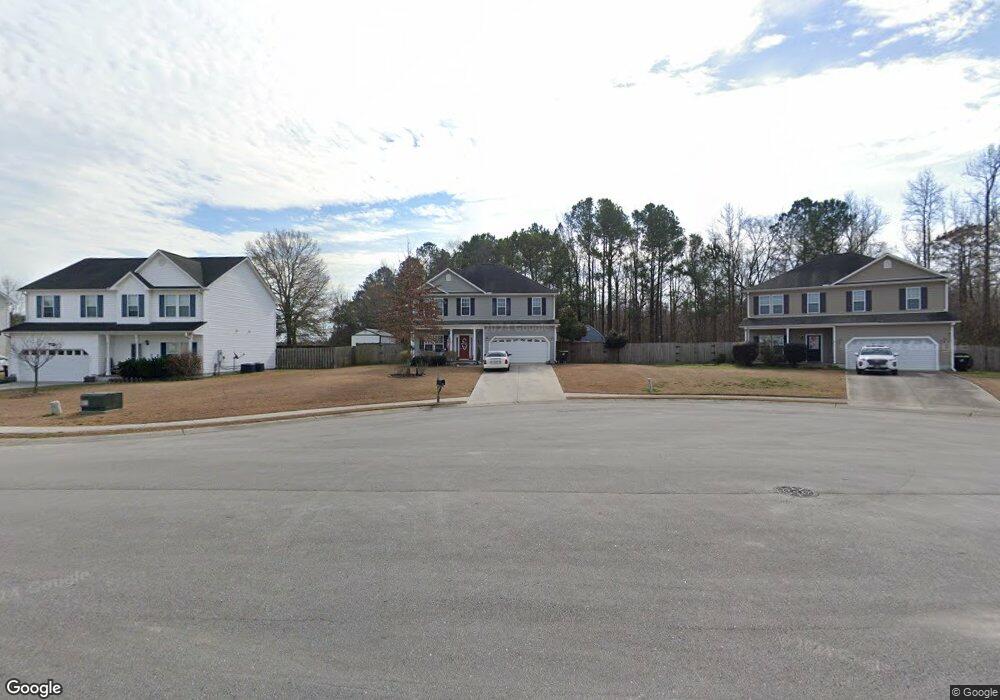
113 Amberwine Cir Richlands, NC 28574
Estimated Value: $328,688 - $358,000
4
Beds
3
Baths
2,241
Sq Ft
$150/Sq Ft
Est. Value
About This Home
This home is located at 113 Amberwine Cir, Richlands, NC 28574 and is currently estimated at $336,672, approximately $150 per square foot. 113 Amberwine Cir is a home located in Onslow County with nearby schools including Richlands Elementary School, Trexler Middle School, and Richlands High School.
Ownership History
Date
Name
Owned For
Owner Type
Purchase Details
Closed on
Jul 26, 2024
Sold by
Vauiso Justin James and Vauiso Kristen Noel
Bought by
Walker Alcide Lavvont and Walker Hannah Danielle
Current Estimated Value
Home Financials for this Owner
Home Financials are based on the most recent Mortgage that was taken out on this home.
Original Mortgage
$304,486
Outstanding Balance
$301,093
Interest Rate
6.95%
Mortgage Type
FHA
Estimated Equity
$35,579
Purchase Details
Closed on
Aug 31, 2009
Sold by
Jerri Builders Inc
Bought by
Vauiso Justin James and Vauiso Kristen N
Home Financials for this Owner
Home Financials are based on the most recent Mortgage that was taken out on this home.
Original Mortgage
$180,225
Interest Rate
5.11%
Mortgage Type
VA
Purchase Details
Closed on
Apr 3, 2009
Sold by
Rhc Construction & Realty Inc
Bought by
Jerri Builders Inc
Home Financials for this Owner
Home Financials are based on the most recent Mortgage that was taken out on this home.
Original Mortgage
$148,000
Interest Rate
5.1%
Mortgage Type
Construction
Create a Home Valuation Report for This Property
The Home Valuation Report is an in-depth analysis detailing your home's value as well as a comparison with similar homes in the area
Home Values in the Area
Average Home Value in this Area
Purchase History
| Date | Buyer | Sale Price | Title Company |
|---|---|---|---|
| Walker Alcide Lavvont | $315,000 | None Listed On Document | |
| Vauiso Justin James | $198,000 | None Available | |
| Jerri Builders Inc | $32,000 | None Available |
Source: Public Records
Mortgage History
| Date | Status | Borrower | Loan Amount |
|---|---|---|---|
| Open | Walker Alcide Lavvont | $304,486 | |
| Previous Owner | Vauiso Justin James | $180,225 | |
| Previous Owner | Jerri Builders Inc | $148,000 |
Source: Public Records
Tax History Compared to Growth
Tax History
| Year | Tax Paid | Tax Assessment Tax Assessment Total Assessment is a certain percentage of the fair market value that is determined by local assessors to be the total taxable value of land and additions on the property. | Land | Improvement |
|---|---|---|---|---|
| 2025 | $2,322 | $224,321 | $40,000 | $184,321 |
| 2024 | $1,856 | $224,321 | $40,000 | $184,321 |
| 2023 | $1,856 | $224,321 | $40,000 | $184,321 |
| 2022 | $2,322 | $224,321 | $40,000 | $184,321 |
| 2021 | $1,895 | $171,530 | $30,000 | $141,530 |
| 2020 | $1,895 | $171,530 | $30,000 | $141,530 |
| 2019 | $1,895 | $171,530 | $30,000 | $141,530 |
| 2018 | $1,861 | $171,530 | $30,000 | $141,530 |
| 2017 | $2,006 | $190,180 | $32,000 | $158,180 |
| 2016 | $2,006 | $190,180 | $0 | $0 |
| 2015 | $2,006 | $190,180 | $0 | $0 |
| 2014 | $2,006 | $190,180 | $0 | $0 |
Source: Public Records
Map
Nearby Homes
- 117 Esquire Dr
- 113 Woods Run Cir
- 107 Woods Run Cir
- 109 Esquire Dr
- 107 Airleigh Place
- 614 S Squires Run Ln
- 618 S Squires Run Ln
- 173 N Squires Run Ln
- 620 S Squires Run Ln
- 610 S Squires Run Ln
- 622 S Squires Run Ln
- 606 S Squires Run Ln
- 506 Bellefonte Ct
- 613 S Squires Run Ln
- 624 S Squires Run Ln
- 615 S Squires Run Ln
- 612 S Squires Run Ln
- 611 S Squires Run Ln
- 604 S Squires Run Ln
- 609 S Squires Run Ln
- 111 Amberwine Cir
- 115 Amberwine Cir
- 109 Amberwine Cir
- 116 Amberwine Cir
- 107 Amberwine Cir
- 114 Amberwine Cir
- 112 Amberwine Cir
- 105 Amberwine Cir
- 108 Amberwine Cir
- 106 Amberwine Cir
- 103 Amberwine Cir
- 104 Amberwine Cir
- 115 Esquire Dr
- 201 Esquire Dr
- 102 Amberwine Cir
- 113 Dukes Lake Cir
- 111 Dukes Lake Cir
- 115 Dukes Lake Cir
- 113 Esquire Dr
- 109 Dukes Lake Cir