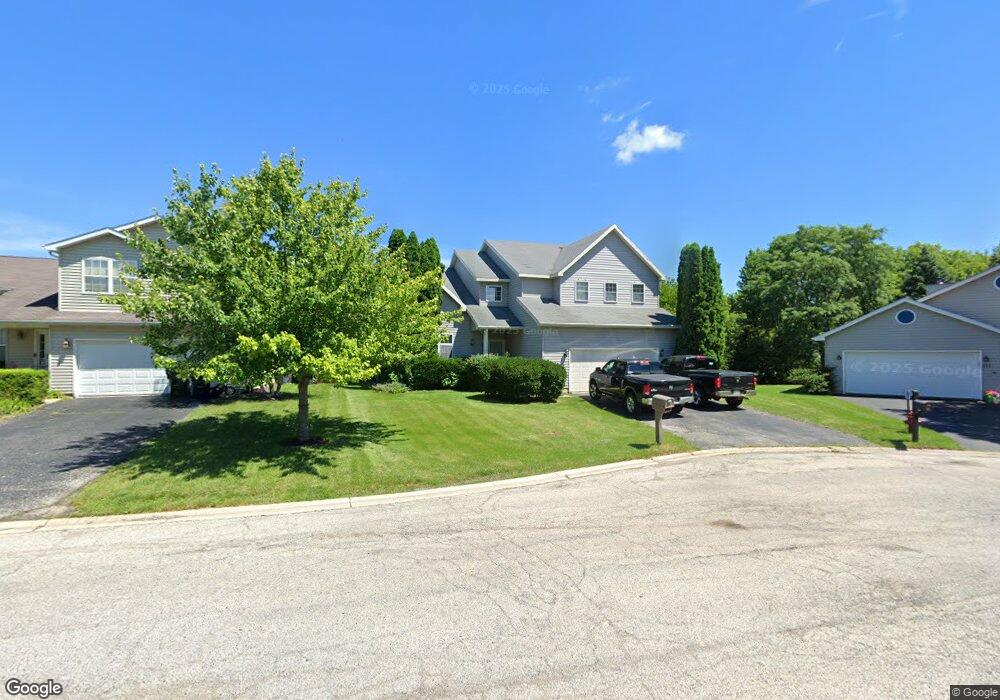
113 Chesapeake Bay Winthrop Harbor, IL 60096
Estimated Value: $377,000 - $454,000
3
Beds
3
Baths
2,400
Sq Ft
$171/Sq Ft
Est. Value
About This Home
This home is located at 113 Chesapeake Bay, Winthrop Harbor, IL 60096 and is currently estimated at $409,496, approximately $170 per square foot. 113 Chesapeake Bay is a home located in Lake County with nearby schools including Westfield School, North Prairie Junior High School, and Zion-Benton Township High School.
Ownership History
Date
Name
Owned For
Owner Type
Purchase Details
Closed on
Jul 13, 2007
Sold by
Breen Bonnie and Wiggett Daniel
Bought by
Currington Doyle L and Currington Carolyn A
Current Estimated Value
Home Financials for this Owner
Home Financials are based on the most recent Mortgage that was taken out on this home.
Original Mortgage
$205,500
Interest Rate
6.77%
Mortgage Type
Unknown
Purchase Details
Closed on
Feb 6, 2004
Sold by
Torres Luis and Torres Lucy
Bought by
Wiggett Daniel and Breen Bonnie
Home Financials for this Owner
Home Financials are based on the most recent Mortgage that was taken out on this home.
Original Mortgage
$188,000
Interest Rate
5.71%
Mortgage Type
Balloon
Purchase Details
Closed on
Sep 13, 1995
Sold by
Gorter David
Bought by
Torres Luis and Torres Lucy
Home Financials for this Owner
Home Financials are based on the most recent Mortgage that was taken out on this home.
Original Mortgage
$20,000
Interest Rate
7.81%
Create a Home Valuation Report for This Property
The Home Valuation Report is an in-depth analysis detailing your home's value as well as a comparison with similar homes in the area
Home Values in the Area
Average Home Value in this Area
Purchase History
| Date | Buyer | Sale Price | Title Company |
|---|---|---|---|
| Currington Doyle L | $274,000 | Chicago Title Insurance Co | |
| Wiggett Daniel | $235,000 | Ticor | |
| Torres Luis | $35,000 | Chicago Title Insurance Co |
Source: Public Records
Mortgage History
| Date | Status | Borrower | Loan Amount |
|---|---|---|---|
| Previous Owner | Currington Doyle L | $205,500 | |
| Previous Owner | Wiggett Daniel | $188,000 | |
| Previous Owner | Torres Luis | $20,000 |
Source: Public Records
Tax History Compared to Growth
Tax History
| Year | Tax Paid | Tax Assessment Tax Assessment Total Assessment is a certain percentage of the fair market value that is determined by local assessors to be the total taxable value of land and additions on the property. | Land | Improvement |
|---|---|---|---|---|
| 2024 | $9,877 | $107,734 | $7,211 | $100,523 |
| 2023 | $9,379 | $100,154 | $6,961 | $93,193 |
| 2022 | $9,379 | $91,700 | $6,793 | $84,907 |
| 2021 | $9,605 | $89,367 | $6,620 | $82,747 |
| 2020 | $9,321 | $85,282 | $6,317 | $78,965 |
| 2019 | $9,099 | $80,912 | $5,993 | $74,919 |
| 2018 | $8,629 | $76,677 | $7,204 | $69,473 |
| 2017 | $8,567 | $72,133 | $6,777 | $65,356 |
| 2016 | $8,348 | $68,672 | $6,452 | $62,220 |
| 2015 | $8,209 | $62,979 | $5,917 | $57,062 |
| 2014 | $7,759 | $62,045 | $10,612 | $51,433 |
| 2012 | $7,630 | $64,476 | $11,028 | $53,448 |
Source: Public Records
Map
Nearby Homes
- 11279 W Russell Rd
- 429 Megan Place
- 432 Megan Place
- 436 Megan Place
- 12122 28th Ave
- 242 Thompson Ave
- 12111 28th Ave
- 0 Garnett Ave
- 43100 N Lewis Ave
- Lt0 39th Ave
- Lt0 128th St
- 42908 N Lewis Ave
- 210 Oak Ln
- 1810 5th St
- 830 Russell Ave
- 630 Whitney Ave
- 3109 11th St
- 737 Franklin Ave
- 3106 13th St
- 1228 Pennsylvania Ave
- 109 Chesapeake Bay
- 117 Chesapeake Bay
- 105 Chesapeake Bay
- 121 Chesapeake Bay
- 129 Chesapeake Bay
- 125 Chesapeake Bay
- 101 Chesapeake Bay
- 133 Chesapeake Bay
- 205 Potomac Ln
- 145 Old Darby Ln
- 209 Potomac Ln
- 213 Potomac Ln
- 102 Old Darby Ln
- 110 Old Darby Ln
- 120 Old Darby Ln
- 217 Potomac Ln
- 150 Old Darby Ln
- 221 Potomac Ln
- 204 Potomac Ln
- 203 Old Darby Ln