Estimated Value: $314,000 - $338,000
3
Beds
2
Baths
1,896
Sq Ft
$174/Sq Ft
Est. Value
About This Home
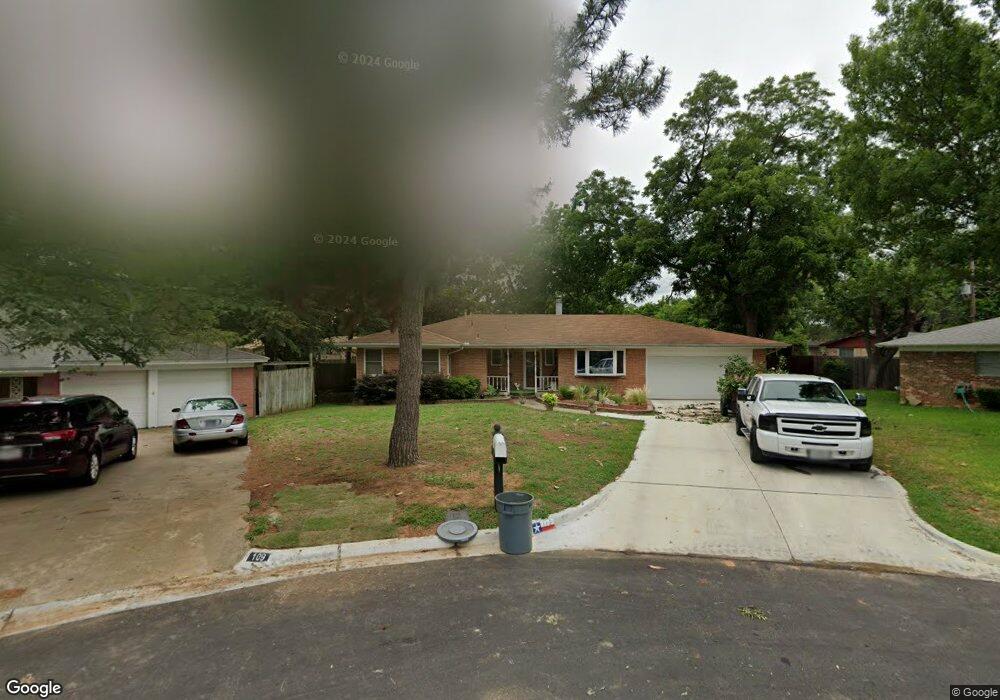
This home is located at 113 Crosstimber Ct, Hurst, TX 76053 and is currently estimated at $330,761, approximately $174 per square foot. 113 Crosstimber Ct is a home located in Tarrant County with nearby schools including West Hurst Elementary School, Hurst J High School, and L.D. Bell High School.
Ownership History
Date
Name
Owned For
Owner Type
Purchase Details
Closed on
May 14, 2003
Sold by
Clark K G and Clark Grace S
Bought by
Lefler Troy and Zeringue Sheryl
Current Estimated Value
Home Financials for this Owner
Home Financials are based on the most recent Mortgage that was taken out on this home.
Original Mortgage
$110,400
Outstanding Balance
$47,982
Interest Rate
5.79%
Mortgage Type
Purchase Money Mortgage
Estimated Equity
$282,779
Purchase Details
Closed on
Aug 30, 1995
Sold by
Hubbell Bobby Wayne and Hubbell Emily Jane
Bought by
Clark K G and Clark Grace S
Home Financials for this Owner
Home Financials are based on the most recent Mortgage that was taken out on this home.
Original Mortgage
$90,640
Interest Rate
8.5%
Mortgage Type
VA
Create a Home Valuation Report for This Property
The Home Valuation Report is an in-depth analysis detailing your home's value as well as a comparison with similar homes in the area
Home Values in the Area
Average Home Value in this Area
Purchase History
| Date | Buyer | Sale Price | Title Company |
|---|---|---|---|
| Lefler Troy | -- | Commonwealth Land Title | |
| Clark K G | -- | Commonwealth Land Title |
Source: Public Records
Mortgage History
| Date | Status | Borrower | Loan Amount |
|---|---|---|---|
| Open | Lefler Troy | $110,400 | |
| Previous Owner | Clark K G | $90,640 |
Source: Public Records
Tax History Compared to Growth
Tax History
| Year | Tax Paid | Tax Assessment Tax Assessment Total Assessment is a certain percentage of the fair market value that is determined by local assessors to be the total taxable value of land and additions on the property. | Land | Improvement |
|---|---|---|---|---|
| 2025 | $4,654 | $332,181 | $60,000 | $272,181 |
| 2024 | $4,654 | $332,181 | $60,000 | $272,181 |
| 2023 | $5,588 | $314,081 | $30,000 | $284,081 |
| 2022 | $5,838 | $287,060 | $30,000 | $257,060 |
| 2021 | $5,560 | $257,868 | $30,000 | $227,868 |
| 2020 | $5,042 | $209,566 | $30,000 | $179,566 |
| 2019 | $4,956 | $219,739 | $30,000 | $189,739 |
| 2018 | $3,910 | $184,077 | $18,000 | $166,077 |
| 2017 | $4,235 | $198,414 | $18,000 | $180,414 |
| 2016 | $3,850 | $176,149 | $18,000 | $158,149 |
| 2015 | $3,184 | $138,300 | $18,000 | $120,300 |
| 2014 | $3,184 | $138,300 | $18,000 | $120,300 |
Source: Public Records
Map
Nearby Homes
- 408 Simmons Dr
- 425 Ridgecrest Dr
- 637 Post Oak Dr
- 520 W Redbud Dr
- 741 Ponderosa Dr
- 744 Briarwood Ln
- 756 Briarwood Ln
- 758 Briarwood Ln
- 808 Betty Ct
- 628 Elm St
- 516 Hurstview Dr
- 612 Elm St
- 425 Moore Creek Rd
- 125 Souder Dr
- 708 Hurstview Dr
- 120 Charlene Dr
- 231 Elm St
- 205 Corinna Ct
- 405 Billy Creek Cir
- 120 Donald Dr
- 117 Crosstimber Ct
- 109 Crosstimber Ct
- 616 Cullum Ave
- 620 Cullum Ave
- 324 Ridgecrest Dr
- 320 Ridgecrest Dr
- 612 Cullum Ave
- 400 Ridgecrest Dr
- 105 Crosstimber Ct
- 112 Crosstimber Ct
- 316 Ridgecrest Dr
- 404 Ridgecrest Dr
- 608 Cullum Ave
- 108 Crosstimber Ct
- 325 Crosstimber Dr
- 104 Crosstimber Ct
- 408 Ridgecrest Dr
- 621 Cullum Ave
- 321 Crosstimber Dr
- 321 Ridgecrest Dr