Estimated Value: $419,000 - $586,000
3
Beds
2
Baths
1,632
Sq Ft
$312/Sq Ft
Est. Value
About This Home
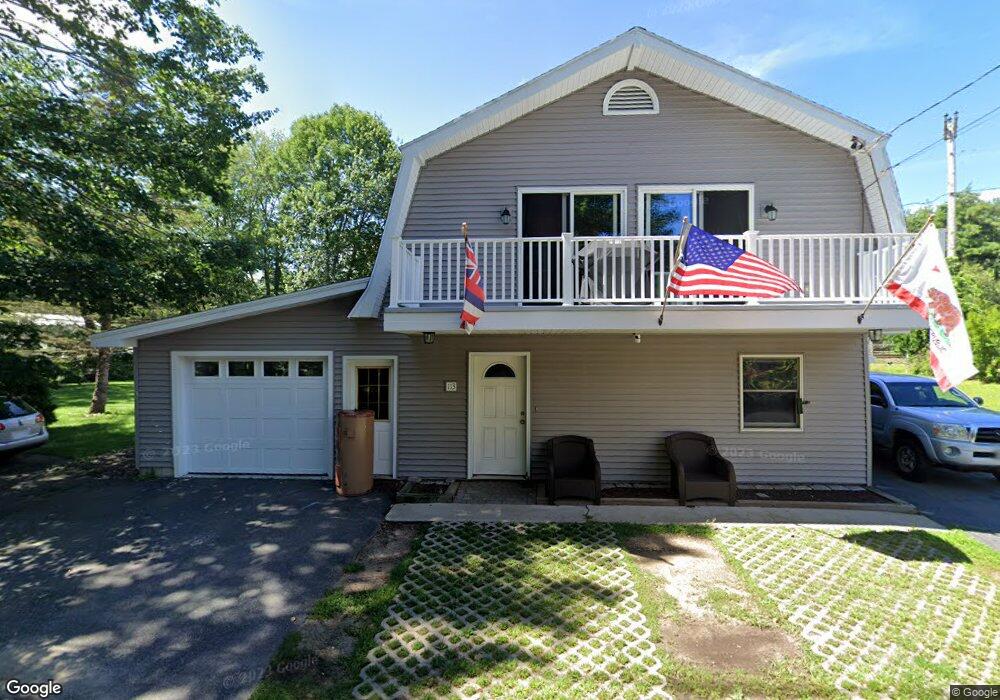
This home is located at 113 Depot Rd, Wells, ME 04090 and is currently estimated at $509,883, approximately $312 per square foot. 113 Depot Rd is a home located in York County with nearby schools including Wells Elementary School, Wells Junior High School, and Wells High School.
Ownership History
Date
Name
Owned For
Owner Type
Purchase Details
Closed on
Apr 16, 2019
Sold by
Ellis William R and Ellis Saralu
Bought by
Ellis Ryan W
Current Estimated Value
Home Financials for this Owner
Home Financials are based on the most recent Mortgage that was taken out on this home.
Original Mortgage
$140,000
Outstanding Balance
$122,580
Interest Rate
4.3%
Mortgage Type
Stand Alone Refi Refinance Of Original Loan
Estimated Equity
$387,303
Purchase Details
Closed on
Jan 18, 2005
Sold by
Bridges Carol L and Bridges Maynard B
Bought by
Cartonio Carmine J
Home Financials for this Owner
Home Financials are based on the most recent Mortgage that was taken out on this home.
Original Mortgage
$160,200
Interest Rate
5.81%
Mortgage Type
Purchase Money Mortgage
Create a Home Valuation Report for This Property
The Home Valuation Report is an in-depth analysis detailing your home's value as well as a comparison with similar homes in the area
Home Values in the Area
Average Home Value in this Area
Purchase History
| Date | Buyer | Sale Price | Title Company |
|---|---|---|---|
| Ellis Ryan W | -- | -- | |
| Ellis Ryan W | -- | -- | |
| Ellis Ryan W | -- | -- | |
| Cartonio Carmine J | -- | -- | |
| Cartonio Carmine J | -- | -- | |
| Cartonio Carmine J | -- | -- |
Source: Public Records
Mortgage History
| Date | Status | Borrower | Loan Amount |
|---|---|---|---|
| Open | Ellis Ryan W | $140,000 | |
| Closed | Ellis Ryan W | $140,000 | |
| Previous Owner | Cartonio Carmine J | $160,200 | |
| Previous Owner | Cartonio Carmine J | $40,050 |
Source: Public Records
Tax History Compared to Growth
Tax History
| Year | Tax Paid | Tax Assessment Tax Assessment Total Assessment is a certain percentage of the fair market value that is determined by local assessors to be the total taxable value of land and additions on the property. | Land | Improvement |
|---|---|---|---|---|
| 2024 | $2,469 | $406,160 | $79,800 | $326,360 |
| 2023 | $2,421 | $406,160 | $79,800 | $326,360 |
| 2022 | $2,109 | $201,670 | $36,330 | $165,340 |
| 2021 | $2,122 | $201,670 | $36,330 | $165,340 |
| 2020 | $2,114 | $201,670 | $36,330 | $165,340 |
| 2019 | $2,082 | $199,780 | $36,330 | $163,450 |
| 2018 | $1,877 | $185,220 | $36,330 | $148,890 |
| 2017 | $1,882 | $185,220 | $36,330 | $148,890 |
| 2016 | $1,863 | $185,220 | $36,330 | $148,890 |
| 2015 | $1,843 | $185,220 | $36,330 | $148,890 |
| 2013 | $1,689 | $185,220 | $36,330 | $148,890 |
Source: Public Records
Map
Nearby Homes
- 21 Whistle Stop Cir
- 89 Skyline Cir
- 47 Whistle Stop Cir
- 392 Sanford Rd
- 417 Sanford Rd
- 1413 Post Rd Unit 58
- 1372 Post Rd Unit 1C
- 90 Poplar Park Dr
- 1373 Post Rd Unit 10A
- 1373 Post Rd Unit 4E
- 1373 Post Rd Unit 2C
- 1373 Post Rd Unit 6B
- 1373 Post Rd Unit 1F
- 1351 Post Rd Unit 49
- 99 Harbor Rd Unit Lot 52
- 99 Harbor Rd Unit Lot 54
- 105 Harbor Rd
- 1762 Post Rd Unit 206
- 1762 Post Rd Unit 233
- 23 College Dr Unit 121