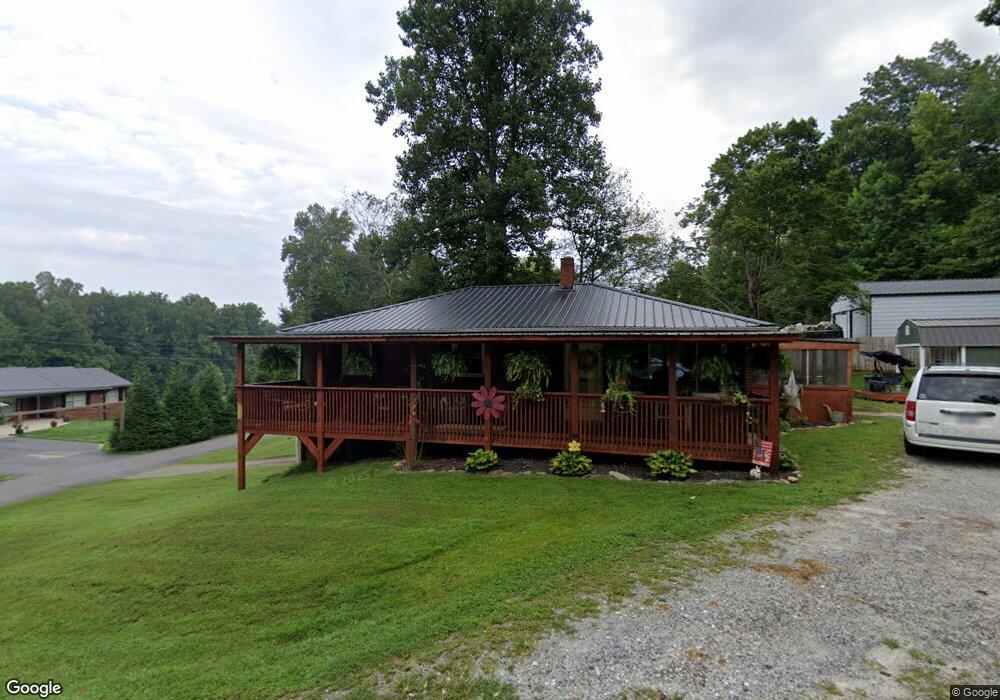
113 Foothills Dr Lenoir, NC 28645
Estimated Value: $165,000 - $258,000
3
Beds
1
Bath
1,107
Sq Ft
$187/Sq Ft
Est. Value
About This Home
This home is located at 113 Foothills Dr, Lenoir, NC 28645 and is currently estimated at $207,376, approximately $187 per square foot. 113 Foothills Dr is a home located in Caldwell County with nearby schools including Lower Creek Elementary School, William Lenoir Middle School, and Hibriten High School.
Ownership History
Date
Name
Owned For
Owner Type
Purchase Details
Closed on
Nov 1, 2021
Sold by
Ogbom Derrick L and Ogbom Amanda
Bought by
Drum Larry E and Drum Teresa E
Current Estimated Value
Purchase Details
Closed on
Apr 14, 2021
Sold by
Drum Lany E and Drum Elaine T
Bought by
Stevens David L and Stevens Sabrina J
Home Financials for this Owner
Home Financials are based on the most recent Mortgage that was taken out on this home.
Original Mortgage
$240,000
Interest Rate
3%
Mortgage Type
New Conventional
Purchase Details
Closed on
Jun 12, 2006
Sold by
Beck Charles and Beck Nancy R
Bought by
Ogborn Derrick L
Home Financials for this Owner
Home Financials are based on the most recent Mortgage that was taken out on this home.
Original Mortgage
$85,900
Interest Rate
6.57%
Mortgage Type
New Conventional
Purchase Details
Closed on
May 13, 2005
Sold by
American General Financial Services Inc
Bought by
Beck Charles K and Beck Rebecca S
Purchase Details
Closed on
Aug 1, 1997
Create a Home Valuation Report for This Property
The Home Valuation Report is an in-depth analysis detailing your home's value as well as a comparison with similar homes in the area
Home Values in the Area
Average Home Value in this Area
Purchase History
| Date | Buyer | Sale Price | Title Company |
|---|---|---|---|
| Drum Larry E | $70,000 | None Available | |
| Stevens David L | $240,000 | None Listed On Document | |
| Ogborn Derrick L | $83,500 | None Available | |
| Beck Charles K | $53,000 | None Available | |
| -- | $64,000 | -- |
Source: Public Records
Mortgage History
| Date | Status | Borrower | Loan Amount |
|---|---|---|---|
| Previous Owner | Stevens David L | $240,000 | |
| Previous Owner | Ogborn Derrick L | $85,900 |
Source: Public Records
Tax History Compared to Growth
Tax History
| Year | Tax Paid | Tax Assessment Tax Assessment Total Assessment is a certain percentage of the fair market value that is determined by local assessors to be the total taxable value of land and additions on the property. | Land | Improvement |
|---|---|---|---|---|
| 2025 | $605 | $172,900 | $12,000 | $160,900 |
| 2024 | $605 | $93,200 | $12,000 | $81,200 |
| 2023 | $605 | $93,200 | $12,000 | $81,200 |
| 2022 | $1,132 | $93,200 | $12,000 | $81,200 |
| 2021 | $1,132 | $93,200 | $12,000 | $81,200 |
| 2020 | $525 | $80,500 | $12,000 | $68,500 |
| 2019 | $525 | $80,500 | $12,000 | $68,500 |
| 2018 | $999 | $80,500 | $0 | $0 |
| 2017 | $999 | $80,500 | $0 | $0 |
| 2016 | $532 | $80,500 | $0 | $0 |
| 2015 | $969 | $80,500 | $0 | $0 |
| 2014 | $969 | $80,500 | $0 | $0 |
Source: Public Records
Map
Nearby Homes
- TBD Hickory Blvd Unit 18 & 20
- 510 Stonecroft Ct SE Unit 32
- 702 SE Chatsworth St
- 702 Chatsworth Cir Unit 1
- 706 SE Chatsworth St
- 706 Chatsworth Cir Unit 2
- 712 SE Chatsworth St
- 708 Chatsworth Cir Unit 3
- 708 SE Chatsworth St
- 710 Chatsworth Cir Unit 4
- 710 SE Chatsworth St
- 712 Chatsworth Cir Unit 5
- 403 Huntington Woods Dr N Unit 29
- 403 Huntington Woods Dr N
- 405 Huntington Woods Dr N Unit 30
- 405 Huntington Woods Dr N
- 401 Huntington Woods Dr N
- 401 Huntington Woods Dr N Unit 28
- 414 Whitmore St SE
- 414 Whitmore St SE Unit 66
- 111 Foothills Dr
- 120 Foothills Dr
- 119 Foothills Dr
- 114 Foothill Dr
- 114 Foothills Dr
- 109 A Foothill Dr
- 109 Foothills Dr
- 109 Foothills Dr Unit A
- 118B Foothill Dr
- 107 Foothills Dr
- 118 Foothills Dr Unit B
- 118 Foothills Dr
- 123 Foothills Dr
- 145 Haigler Rd SE
- 145 Haigler Rd SE
- 138 Haigler Rd SE
- 123 Haigler Rd SE
- 103 Foothills Dr
- 101 Foothills Dr
- 132 Haigler Rd SE