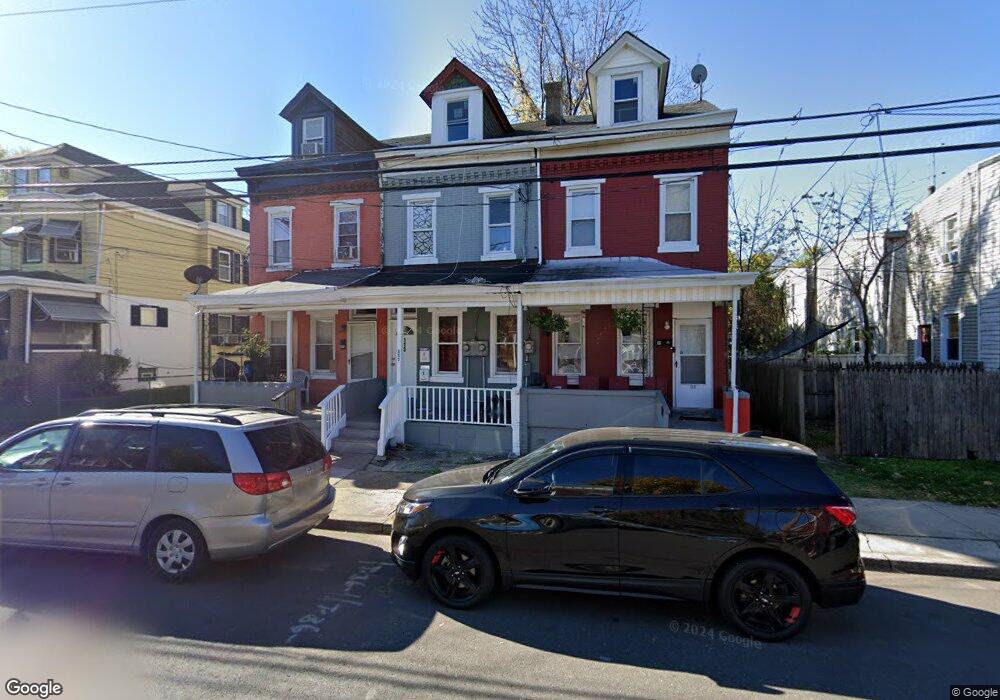
113 S Cook Ave Trenton, NJ 08609
Wilbur NeighborhoodEstimated Value: $142,673 - $194,000
--
Bed
--
Bath
1,232
Sq Ft
$140/Sq Ft
Est. Value
About This Home
This home is located at 113 S Cook Ave, Trenton, NJ 08609 and is currently estimated at $172,918, approximately $140 per square foot. 113 S Cook Ave is a home located in Mercer County with nearby schools including P.J. Hill Elementary School, Grant Elementary School, and Dr. Martin Luther King Middle School.
Ownership History
Date
Name
Owned For
Owner Type
Purchase Details
Closed on
Jun 24, 2022
Sold by
Englander Raizy
Bought by
Bh 113 S Cook Llc
Current Estimated Value
Purchase Details
Closed on
May 17, 2022
Sold by
S Cook Ave Inc
Bought by
Englander Raizy
Purchase Details
Closed on
Nov 23, 2018
Sold by
Orange State Llc
Bought by
S Cool Ave Inc
Purchase Details
Closed on
Sep 26, 2014
Sold by
Yeseab Alfred and Yeseab Daphnee Yeseab
Bought by
Americas Servicing Co and Select Portfolio Servicin
Home Financials for this Owner
Home Financials are based on the most recent Mortgage that was taken out on this home.
Interest Rate
4.2%
Purchase Details
Closed on
May 5, 2006
Sold by
Katz Solomon
Bought by
Yeseab Alfred
Home Financials for this Owner
Home Financials are based on the most recent Mortgage that was taken out on this home.
Original Mortgage
$88,000
Interest Rate
6.42%
Purchase Details
Closed on
May 16, 2005
Sold by
Rappaport Dov
Bought by
Katz Nathan and Katz Solomon
Purchase Details
Closed on
Apr 21, 2005
Sold by
Payton Margaret
Bought by
Rappaport Dov
Create a Home Valuation Report for This Property
The Home Valuation Report is an in-depth analysis detailing your home's value as well as a comparison with similar homes in the area
Home Values in the Area
Average Home Value in this Area
Purchase History
| Date | Buyer | Sale Price | Title Company |
|---|---|---|---|
| Bh 113 S Cook Llc | -- | Dekel Abstract | |
| Bh 113 S Cook Llc | -- | Dekel Abstract | |
| Englander Raizy | $84,000 | Dekel Abstract | |
| Englander Raizy | $84,000 | Dekel Abstract | |
| S Cool Ave Inc | $27,000 | Dekel Abstract Llc | |
| Americas Servicing Co | -- | -- | |
| Yeseab Alfred | $104,500 | -- | |
| Katz Nathan | $120,000 | -- | |
| Rappaport Dov | $50,000 | -- |
Source: Public Records
Mortgage History
| Date | Status | Borrower | Loan Amount |
|---|---|---|---|
| Previous Owner | Americas Servicing Co | -- | |
| Previous Owner | Yeseab Alfred | $88,000 |
Source: Public Records
Tax History Compared to Growth
Tax History
| Year | Tax Paid | Tax Assessment Tax Assessment Total Assessment is a certain percentage of the fair market value that is determined by local assessors to be the total taxable value of land and additions on the property. | Land | Improvement |
|---|---|---|---|---|
| 2025 | $2,779 | $47,900 | $5,000 | $42,900 |
| 2024 | $2,667 | $47,900 | $5,000 | $42,900 |
| 2023 | $2,667 | $47,900 | $5,000 | $42,900 |
| 2022 | $1,457 | $26,700 | $5,000 | $21,700 |
| 2021 | $1,483 | $26,700 | $5,000 | $21,700 |
| 2020 | $1,478 | $26,700 | $5,000 | $21,700 |
| 2019 | $1,454 | $26,700 | $5,000 | $21,700 |
| 2018 | $1,392 | $26,700 | $5,000 | $21,700 |
| 2017 | $1,323 | $26,700 | $5,000 | $21,700 |
| 2016 | $2,123 | $36,900 | $9,000 | $27,900 |
| 2015 | $2,115 | $36,900 | $9,000 | $27,900 |
| 2014 | $2,106 | $36,900 | $9,000 | $27,900 |
Source: Public Records
Map
Nearby Homes
- 346 Walnut Ave
- 327 Walnut Ave
- 313 Tioga St
- 937 Greenwood Ave
- 239 Tioga St
- 837 E State St
- 225 S Cook Ave
- 812 E State St
- 106 Chambers St
- 110 Chambers St
- 112 Chambers St
- 108 Chambers St
- 114 Chambers St
- 116 Chambers St
- 251 S Walter Ave
- 238 S Walter Ave
- 63 Garfield Ave
- 66 N Olden Ave
- 48 Grant St
- 325 Cuyler Ave