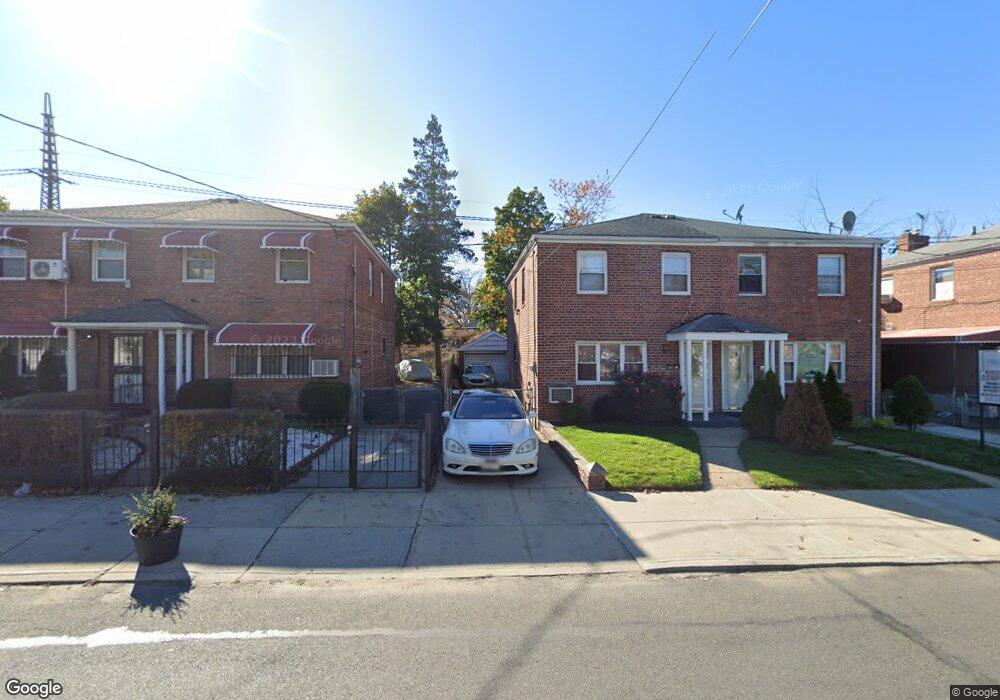
11304 Dunkirk St Saint Albans, NY 11412
Hollis NeighborhoodEstimated Value: $572,122 - $751,000
--
Bed
--
Bath
1,188
Sq Ft
$551/Sq Ft
Est. Value
About This Home
This home is located at 11304 Dunkirk St, Saint Albans, NY 11412 and is currently estimated at $654,531, approximately $550 per square foot. 11304 Dunkirk St is a home located in Queens County with nearby schools including Ps 36 St Albans School, Is 59 Springfield Gardens, and Riverton Street Charter School.
Ownership History
Date
Name
Owned For
Owner Type
Purchase Details
Closed on
Sep 26, 2006
Sold by
Braithwaite Barbara and Braithwaite Darren
Bought by
Richards Christopher and Richards Janell
Current Estimated Value
Home Financials for this Owner
Home Financials are based on the most recent Mortgage that was taken out on this home.
Original Mortgage
$250,000
Outstanding Balance
$149,345
Interest Rate
6.48%
Mortgage Type
Purchase Money Mortgage
Estimated Equity
$505,186
Purchase Details
Closed on
Aug 14, 2002
Sold by
Beckham Kevin and Beckham Tonya
Bought by
Richards Janell and Braithwaite Kenneth
Home Financials for this Owner
Home Financials are based on the most recent Mortgage that was taken out on this home.
Original Mortgage
$190,000
Interest Rate
6.25%
Purchase Details
Closed on
Oct 1, 1996
Sold by
Dyer Pauline and Woodson Pauline
Bought by
Beckham Kevin and Beckham Tonya
Home Financials for this Owner
Home Financials are based on the most recent Mortgage that was taken out on this home.
Original Mortgage
$144,850
Interest Rate
7.83%
Mortgage Type
FHA
Create a Home Valuation Report for This Property
The Home Valuation Report is an in-depth analysis detailing your home's value as well as a comparison with similar homes in the area
Home Values in the Area
Average Home Value in this Area
Purchase History
| Date | Buyer | Sale Price | Title Company |
|---|---|---|---|
| Richards Christopher | -- | -- | |
| Richards Christopher | -- | -- | |
| Richards Janell | -- | -- | |
| Richards Janell | -- | -- | |
| Beckham Kevin | $149,000 | -- | |
| Beckham Kevin | $149,000 | -- |
Source: Public Records
Mortgage History
| Date | Status | Borrower | Loan Amount |
|---|---|---|---|
| Open | Richards Christopher | $250,000 | |
| Closed | Richards Christopher | $250,000 | |
| Previous Owner | Richards Janell | $190,000 | |
| Previous Owner | Beckham Kevin | $144,850 |
Source: Public Records
Tax History Compared to Growth
Tax History
| Year | Tax Paid | Tax Assessment Tax Assessment Total Assessment is a certain percentage of the fair market value that is determined by local assessors to be the total taxable value of land and additions on the property. | Land | Improvement |
|---|---|---|---|---|
| 2025 | $4,873 | $26,335 | $10,076 | $16,259 |
| 2024 | $4,885 | $25,661 | $10,545 | $15,116 |
| 2023 | $4,671 | $24,656 | $9,787 | $14,869 |
| 2022 | $4,357 | $32,820 | $13,980 | $18,840 |
| 2021 | $4,323 | $31,320 | $13,980 | $17,340 |
| 2020 | $4,349 | $29,820 | $13,980 | $15,840 |
| 2019 | $4,180 | $28,140 | $13,980 | $14,160 |
| 2018 | $3,891 | $20,547 | $10,164 | $10,383 |
| 2017 | $3,652 | $19,384 | $10,779 | $8,605 |
| 2016 | $3,346 | $19,384 | $10,779 | $8,605 |
| 2015 | $1,986 | $18,288 | $9,966 | $8,322 |
| 2014 | $1,986 | $17,820 | $11,640 | $6,180 |
Source: Public Records
Map
Nearby Homes
- 179-07 Murdock Ave
- 11176 180th St
- 112- 2 178th St
- 112-13 178th St
- 111-54 178th Place
- 17709 112th Ave
- 11480 178th Place
- 115-11 180th St
- 188-07 Mangin Ave
- 17718 Sayres Ave
- 183-34 Fonda Ave
- 187-15 Tioga Dr
- 112-26 176th St
- 177-08 Sayres Ave
- 188-45 Quencer Rd
- 186-16 Hilburn Ave
- 18823 Mangin Ave
- 114-88 177th Place
- 188-25 Mangin Ave
- 18833 Keeseville Ave
- 11302 Dunkirk St
- 11308 Dunkirk St
- 11310 Dunkirk St
- 11222 Dunkirk St
- 113-10 Dunkirk St
- 11314 Dunkirk St
- 11220 Dunkirk St
- 11316 Dunkirk St
- 11218 Dunkirk St
- 11316 Dunkirk St
- 18502 Jordan Ave
- 11216 Dunkirk St
- 11216 Dunkirk St
- 11212 Dunkirk St
- 185-03 Jordan Ave
- 18503 Jordan Ave
- 18506 Jordan Ave
- 18505 Murdock Ave
- 11210 Dunkirk St
- 112-10 Dunkirk St