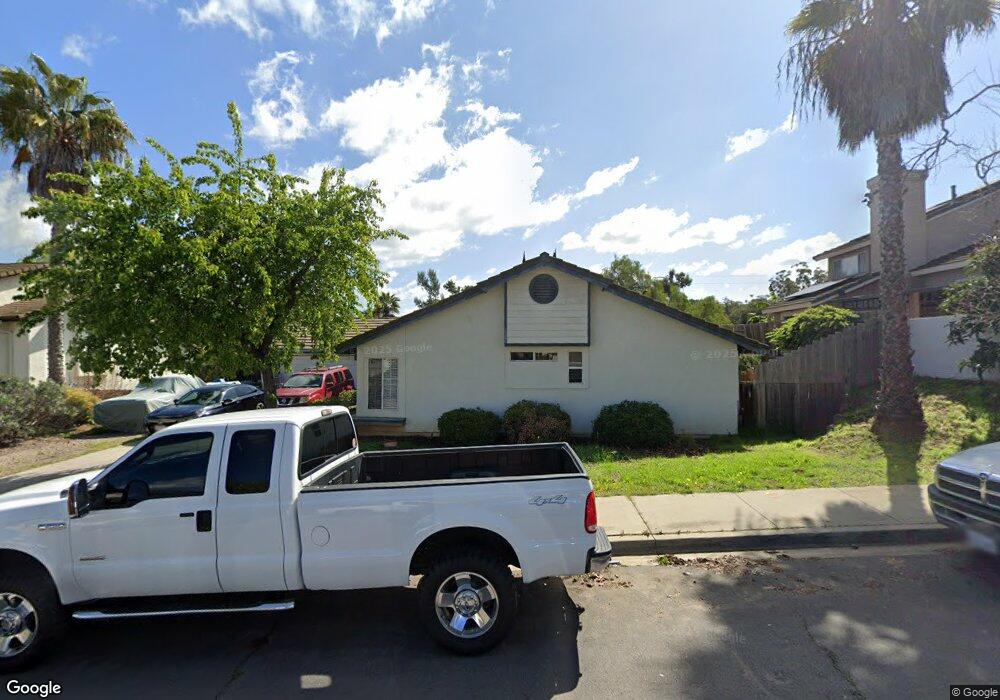
1134 Catspaw Place Escondido, CA 92029
Felicita NeighborhoodEstimated Value: $824,000 - $943,000
About This Home
Single story 3 bedroom 2 bath house in the 92029 zip code. Close to shopping and easy freeway access. Has been updated with vinyl plank flooring in living room, family room, dining room. Carpeted bedrooms. Bathrooms have updated sinks and fixtures. A/C, Furnace and ductwork has been replaced, Electric stove, dishwasher, microwave, refrigerator and washer/dryer provided. Kitchen has breakfast bar and plenty of cabinet space and pantry. Garden window for your plants over the sink. Fireplace in family room. Two car oversized garage. Cul-de-sac street.
Security deposit is $3500. Current credit report required. Rental application required. Property will be managed by a property manager who has managed the property in the past and is familiar with the property
Ownership History
Purchase Details
Purchase Details
Purchase Details
Purchase Details
Home Values in the Area
Average Home Value in this Area
Purchase History
| Date | Buyer | Sale Price | Title Company |
|---|---|---|---|
| Craig J Ives Trust | -- | None Listed On Document | |
| Ives Craig J | -- | None Listed On Document | |
| Brokaw Barbara J | -- | None Listed On Document | |
| Brokaw Barbara J | -- | -- | |
| -- | $156,200 | -- |
Property History
| Date | Event | Price | List to Sale | Price per Sq Ft |
|---|---|---|---|---|
| 10/08/2024 10/08/24 | Off Market | $3,500 | -- | -- |
| 09/21/2024 09/21/24 | For Rent | $3,500 | -- | -- |
Tax History Compared to Growth
Tax History
| Year | Tax Paid | Tax Assessment Tax Assessment Total Assessment is a certain percentage of the fair market value that is determined by local assessors to be the total taxable value of land and additions on the property. | Land | Improvement |
|---|---|---|---|---|
| 2025 | $3,308 | $293,084 | $124,208 | $168,876 |
| 2024 | $3,308 | $287,338 | $121,773 | $165,565 |
| 2023 | $3,233 | $281,705 | $119,386 | $162,319 |
| 2022 | $3,199 | $276,183 | $117,046 | $159,137 |
| 2021 | $3,147 | $270,768 | $114,751 | $156,017 |
| 2020 | $3,129 | $267,993 | $113,575 | $154,418 |
| 2019 | $3,054 | $262,740 | $111,349 | $151,391 |
| 2018 | $2,970 | $257,589 | $109,166 | $148,423 |
| 2017 | $2,922 | $252,539 | $107,026 | $145,513 |
| 2016 | $2,865 | $247,588 | $104,928 | $142,660 |
| 2015 | $2,842 | $243,870 | $103,352 | $140,518 |
| 2014 | $2,725 | $239,094 | $101,328 | $137,766 |
Map
- 1575 W Valley Pkwy Unit 25
- 1110 Gaucho Place
- 1461 Autumn Woods Place
- 1756 Alhudson Dr
- 1225 Lancer Glen
- 1001 S Hale Ave Unit 13
- 1369 W 11th Ave
- 2243 Avenida Del Diablo
- 1630 Amanda Glen Ln
- 1640 Amanda Glen Ln
- 1045 Howard Ave
- 1390 Amanda Ln
- 1390 Amanda Glen Ln N
- 1007 Howard Ave Unit 42
- 1772 Crescent Knolls Glen
- 1640 Amanda Ln
- 1620 Amanda Ln
- 2010 Palsero Ave
- 955 Howard Ave Unit 40
- 1750 W Citracado Pkwy Unit 157
- 1124 Catspaw Place
- 1144 Catspaw Place
- 1559 W 11th Ave
- 1135 Catspaw Place
- 1571 W 11th Ave
- 1561 W 11th Ave
- 1145 Catspaw Place
- 1125 Catspaw Place
- 1623 W 11th Ave
- 1555 W 11th Ave
- 1154 Catspaw Place
- 1155 Catspaw Place
- 1563 W 11th Ave
- 1629 W 11th Ave
- 1164 Catspaw Place
- 1165 Catspaw Place
- 1624 W 11th Ave
- 1658 Lisbon Place
- 1654 Lisbon Place
- 1650 Lisbon Place