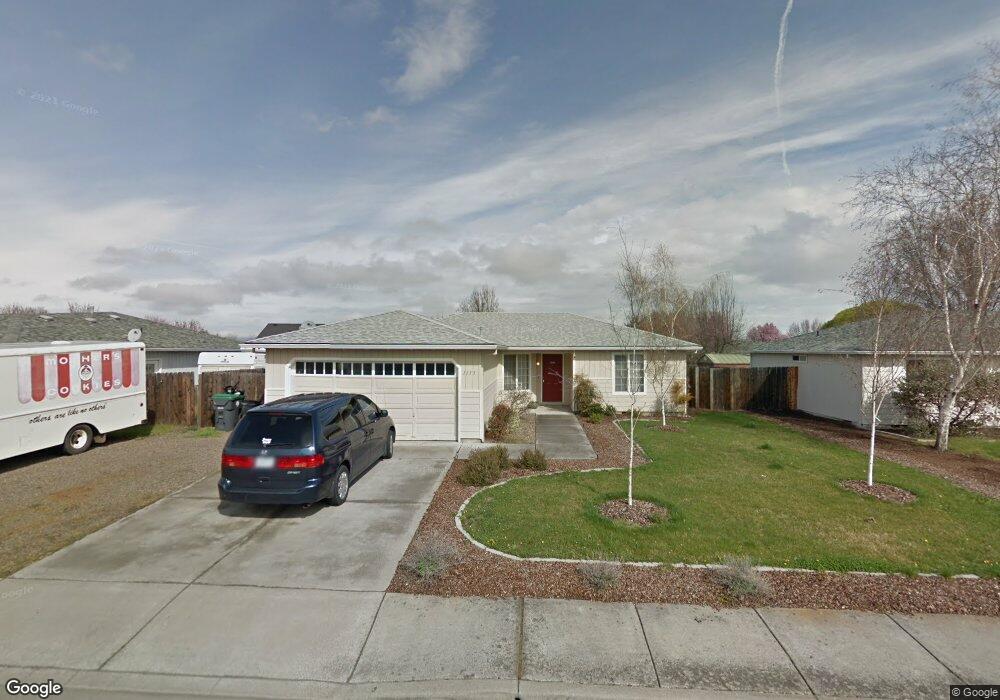
1135 Gate Park Dr Central Point, OR 97502
Estimated Value: $354,674 - $374,000
3
Beds
2
Baths
1,273
Sq Ft
$285/Sq Ft
Est. Value
About This Home
This home is located at 1135 Gate Park Dr, Central Point, OR 97502 and is currently estimated at $362,419, approximately $284 per square foot. 1135 Gate Park Dr is a home located in Jackson County with nearby schools including Central Point Elementary School, Scenic Middle School, and Crater High School.
Ownership History
Date
Name
Owned For
Owner Type
Purchase Details
Closed on
Dec 24, 2008
Sold by
Revoca Springer Julianna Marie and Revoca Julianna Marie Springer
Bought by
Taylor Jared J
Current Estimated Value
Home Financials for this Owner
Home Financials are based on the most recent Mortgage that was taken out on this home.
Original Mortgage
$154,900
Outstanding Balance
$101,848
Interest Rate
6.03%
Mortgage Type
VA
Estimated Equity
$260,571
Purchase Details
Closed on
Jun 9, 1999
Sold by
Springer Juliana Trstee Fbo
Bought by
Springer Juliana M
Home Financials for this Owner
Home Financials are based on the most recent Mortgage that was taken out on this home.
Original Mortgage
$73,100
Interest Rate
6.87%
Purchase Details
Closed on
Jun 7, 1996
Sold by
Korpa Michael A and Korpa Victoria J
Bought by
Springer Juliana Marie
Create a Home Valuation Report for This Property
The Home Valuation Report is an in-depth analysis detailing your home's value as well as a comparison with similar homes in the area
Home Values in the Area
Average Home Value in this Area
Purchase History
| Date | Buyer | Sale Price | Title Company |
|---|---|---|---|
| Taylor Jared J | $180,000 | Lawyers Title Ins | |
| Springer Juliana M | -- | Crater Title Insurance | |
| Springer Juliana Marie | $95,000 | -- |
Source: Public Records
Mortgage History
| Date | Status | Borrower | Loan Amount |
|---|---|---|---|
| Open | Taylor Jared J | $154,900 | |
| Previous Owner | Springer Juliana M | $73,100 |
Source: Public Records
Tax History Compared to Growth
Tax History
| Year | Tax Paid | Tax Assessment Tax Assessment Total Assessment is a certain percentage of the fair market value that is determined by local assessors to be the total taxable value of land and additions on the property. | Land | Improvement |
|---|---|---|---|---|
| 2025 | $3,033 | $182,450 | $56,170 | $126,280 |
| 2024 | $3,033 | $177,140 | $54,540 | $122,600 |
| 2023 | $2,936 | $171,990 | $52,950 | $119,040 |
| 2022 | $2,868 | $171,990 | $52,950 | $119,040 |
| 2021 | $2,786 | $166,990 | $51,410 | $115,580 |
| 2020 | $2,704 | $162,130 | $49,910 | $112,220 |
| 2019 | $2,638 | $152,830 | $47,040 | $105,790 |
| 2018 | $2,557 | $148,380 | $45,670 | $102,710 |
| 2017 | $2,493 | $148,380 | $45,670 | $102,710 |
| 2016 | $2,420 | $139,870 | $43,050 | $96,820 |
| 2015 | $2,319 | $139,870 | $43,050 | $96,820 |
| 2014 | $2,260 | $131,850 | $40,580 | $91,270 |
Source: Public Records
Map
Nearby Homes
- 3119 Merriman Rd
- 1017 Fairfield Ave
- 1025 Fairfield Ave
- 959 Westrop Dr
- 1060 Hopkins Rd
- 921 Pittview Ave
- 881 Westrop Dr
- 928 Brandi Way
- 2825 Howard Ave
- 659 Herman Ave
- 460 Federal Way
- 811 O'Hare Pkwy
- 745 Herman Ave
- 709 Lawnsdale Rd
- 191 Mellecker Way
- 3358 Bursell Rd
- 199 Mellecker Way
- 851 Juanita Way
- 3364 Bursell Rd
- 529 Black Bear Dr
- 1145 Gate Park Dr
- 1125 Gate Park Dr
- 1120 Paisley Ct
- 1155 Gate Park Dr
- 1126 Paisley Ct
- 1130 Gate Park Dr
- 1119 Gate Park Dr
- 106 Queens Gate Ct
- 1140 Gate Park Dr
- 1120 Gate Park Dr
- 1212 Wedgewood Dr Unit 5
- 1118 Gate Park Dr
- 1150 Gate Park Dr
- 105 Queens Gate Ct
- 1115 Gate Park Dr
- 104 Queens Gate Ct
- 1114 Paisley Ct
- 1125 Paisley Ct
- 1160 Gate Park Dr
- 1116 Gate Park Dr