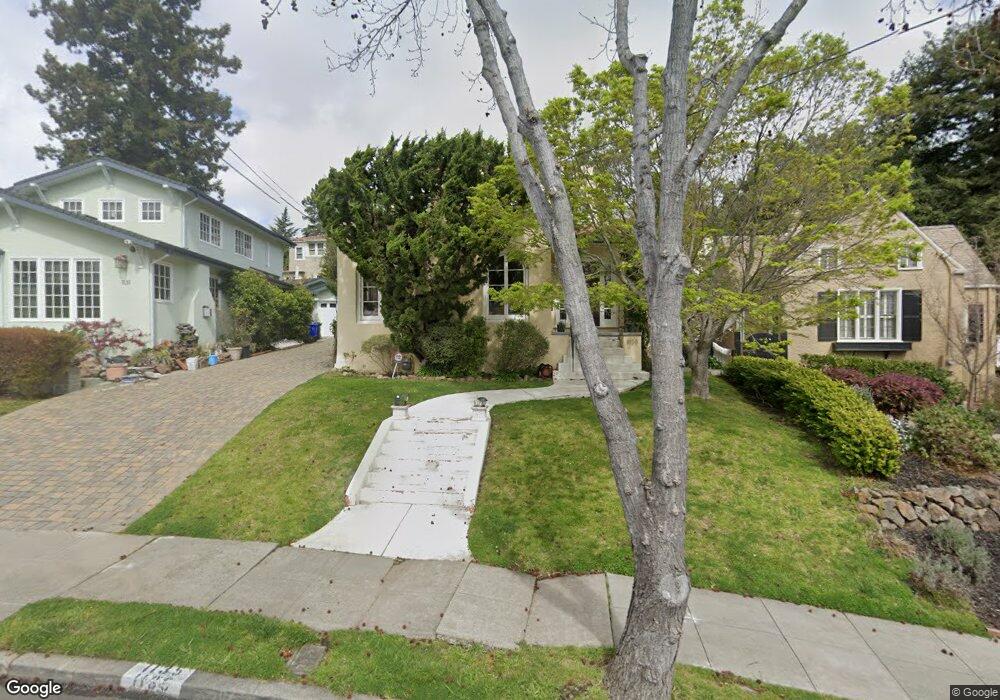
1135 Harvard Rd Piedmont, CA 94610
Central Piedmont NeighborhoodEstimated Value: $1,149,000 - $1,608,497
2
Beds
2
Baths
2,070
Sq Ft
$713/Sq Ft
Est. Value
About This Home
This home is located at 1135 Harvard Rd, Piedmont, CA 94610 and is currently estimated at $1,475,624, approximately $712 per square foot. 1135 Harvard Rd is a home located in Alameda County with nearby schools including Piedmont Middle School, Piedmont High School, and St. Leo the Great School.
Ownership History
Date
Name
Owned For
Owner Type
Purchase Details
Closed on
Feb 17, 2025
Sold by
Jinich Samuel
Bought by
Jinich Elizabeth Murphy
Current Estimated Value
Purchase Details
Closed on
Mar 4, 2003
Sold by
Jinich Horcaio and Jinich Sonia
Bought by
Jinich Samuel and Jinich Elizabeth Murphy
Home Financials for this Owner
Home Financials are based on the most recent Mortgage that was taken out on this home.
Original Mortgage
$317,000
Interest Rate
5.83%
Purchase Details
Closed on
Jun 25, 1998
Sold by
Lim Dion M and Lin Amy J
Bought by
Jinich Samuel and Jinich Elizabeth Murphy
Home Financials for this Owner
Home Financials are based on the most recent Mortgage that was taken out on this home.
Original Mortgage
$227,150
Interest Rate
7.06%
Create a Home Valuation Report for This Property
The Home Valuation Report is an in-depth analysis detailing your home's value as well as a comparison with similar homes in the area
Home Values in the Area
Average Home Value in this Area
Purchase History
| Date | Buyer | Sale Price | Title Company |
|---|---|---|---|
| Jinich Elizabeth Murphy | -- | None Listed On Document | |
| Jinich Samuel | $89,000 | Placer Title Company | |
| Jinich Samuel | $345,000 | Old Republic Title Company |
Source: Public Records
Mortgage History
| Date | Status | Borrower | Loan Amount |
|---|---|---|---|
| Previous Owner | Jinich Samuel | $317,000 | |
| Previous Owner | Jinich Samuel | $227,150 |
Source: Public Records
Tax History Compared to Growth
Tax History
| Year | Tax Paid | Tax Assessment Tax Assessment Total Assessment is a certain percentage of the fair market value that is determined by local assessors to be the total taxable value of land and additions on the property. | Land | Improvement |
|---|---|---|---|---|
| 2025 | $13,523 | $709,326 | $162,248 | $554,078 |
| 2024 | $13,523 | $695,284 | $159,068 | $543,216 |
| 2023 | $13,303 | $688,516 | $155,949 | $532,567 |
| 2022 | $12,942 | $668,018 | $152,892 | $522,126 |
| 2021 | $12,420 | $654,784 | $149,894 | $511,890 |
| 2020 | $12,348 | $654,999 | $148,357 | $506,642 |
| 2019 | $11,986 | $642,159 | $145,449 | $496,710 |
| 2018 | $11,599 | $629,571 | $142,598 | $486,973 |
| 2017 | $11,566 | $617,229 | $139,802 | $477,427 |
| 2016 | $10,790 | $605,128 | $137,061 | $468,067 |
| 2015 | $10,757 | $596,041 | $135,003 | $461,038 |
| 2014 | $10,632 | $584,366 | $132,358 | $452,008 |
Source: Public Records
Map
Nearby Homes
- 1074 Annerley Rd
- 240 Wildwood Ave
- 1140 Winsor Ave
- 707 Arimo Ave
- 3925 Balfour Ave
- 25 Crocker Ave
- 801 Mandana Blvd
- 725 Carlston Ave
- 33 Richardson Way
- 44 Farragut Ave
- 61 Wildwood Ave
- 0 Fair Ave Unit 41113850
- 542 Midcrest Rd
- 907 York St
- 2026 Oakland Ave
- 62 Farragut Ave
- 2058 Oakland Ave
- 654 Mandana Blvd Unit 654
- 1131 Harvard Rd
- 1139 Harvard Rd
- 1129 Harvard Rd
- 78 Oakmont Ave
- 76 Oakmont Ave
- 80 Oakmont Ave
- 1143 Harvard Rd
- 72 Oakmont Ave
- 82 Oakmont Ave
- 1121 Harvard Rd
- 68 Oakmont Ave
- 1147 Harvard Rd
- 66 Oakmont Ave
- 1126 Harvard Rd
- 88 Oakmont Ave
- 84 Oakmont Ave
- 1130 Harvard Rd
- 1115 Harvard Rd
- 90 Oakmont Ave
- 1151 Harvard Rd