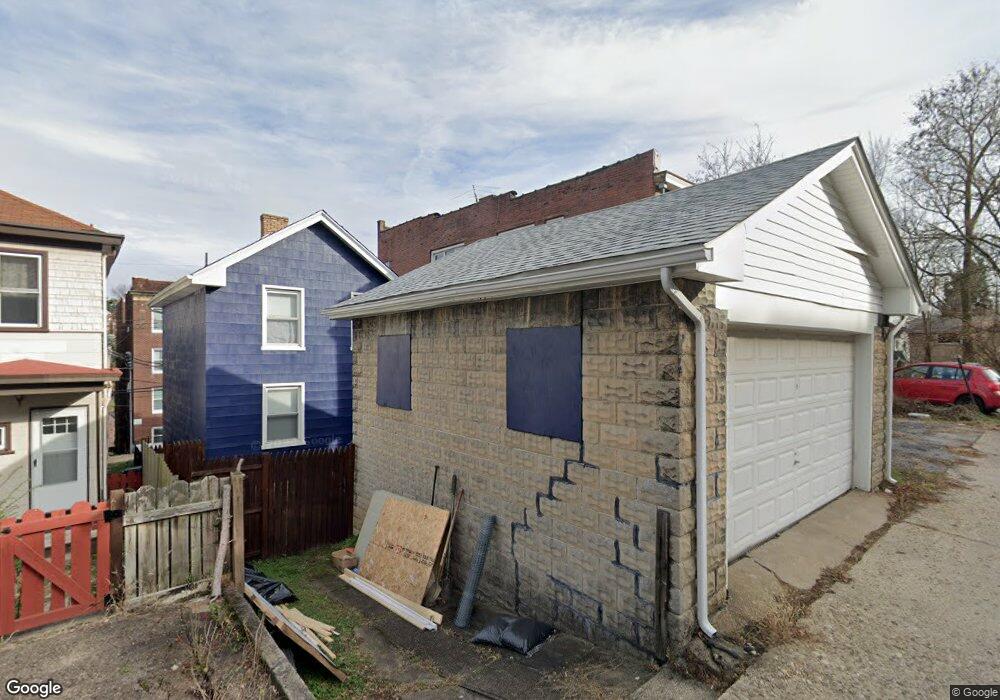
1137 Illinois Ave Pittsburgh, PA 15216
Estimated Value: $105,000 - $184,000
2
Beds
1
Bath
1,024
Sq Ft
$144/Sq Ft
Est. Value
About This Home
This home is located at 1137 Illinois Ave, Pittsburgh, PA 15216 and is currently estimated at $147,082, approximately $143 per square foot. 1137 Illinois Ave is a home located in Allegheny County with nearby schools including Keystone Oaks Middle School, Keystone Oaks High School, and St John Bosco Academy.
Ownership History
Date
Name
Owned For
Owner Type
Purchase Details
Closed on
Oct 10, 2024
Sold by
Saul Danielle and Seaman Danille
Bought by
Seaman Danielle and Seaman Trent
Current Estimated Value
Purchase Details
Closed on
Oct 3, 2024
Sold by
Seaman Trent
Bought by
Seaman Trent and Seaman Danielle
Purchase Details
Closed on
Jun 21, 2006
Sold by
Keenan James S
Bought by
Seaman Trent
Home Financials for this Owner
Home Financials are based on the most recent Mortgage that was taken out on this home.
Original Mortgage
$33,700
Interest Rate
6.6%
Mortgage Type
New Conventional
Purchase Details
Closed on
Dec 15, 1998
Sold by
Keenan James S and Keenan Chris A
Bought by
Keenan James S
Purchase Details
Closed on
May 31, 1995
Sold by
Difofi Dino
Bought by
Keenan James S and Keenan Chris A
Purchase Details
Closed on
Jan 1, 1900
Create a Home Valuation Report for This Property
The Home Valuation Report is an in-depth analysis detailing your home's value as well as a comparison with similar homes in the area
Home Values in the Area
Average Home Value in this Area
Purchase History
| Date | Buyer | Sale Price | Title Company |
|---|---|---|---|
| Seaman Trent | -- | -- | |
| Seaman Trent | $42,160 | -- | |
| Keenan James S | -- | -- | |
| Keenan James S | $44,900 | -- | |
| -- | -- | -- | |
| Seaman Danielle | -- | -- |
Source: Public Records
Mortgage History
| Date | Status | Borrower | Loan Amount |
|---|---|---|---|
| Previous Owner | Seaman Trent | $33,700 |
Source: Public Records
Tax History Compared to Growth
Tax History
| Year | Tax Paid | Tax Assessment Tax Assessment Total Assessment is a certain percentage of the fair market value that is determined by local assessors to be the total taxable value of land and additions on the property. | Land | Improvement |
|---|---|---|---|---|
| 2025 | $1,773 | $49,000 | $24,900 | $24,100 |
| 2024 | $1,773 | $49,000 | $24,900 | $24,100 |
| 2023 | $1,773 | $49,000 | $24,900 | $24,100 |
| 2022 | $1,753 | $49,000 | $24,900 | $24,100 |
| 2021 | $232 | $49,000 | $24,900 | $24,100 |
| 2020 | $1,676 | $49,000 | $24,900 | $24,100 |
| 2019 | $1,666 | $49,000 | $24,900 | $24,100 |
| 2018 | $232 | $49,000 | $24,900 | $24,100 |
| 2017 | $1,625 | $48,100 | $24,900 | $23,200 |
| 2016 | $228 | $48,100 | $24,900 | $23,200 |
| 2015 | $228 | $48,100 | $24,900 | $23,200 |
| 2014 | $1,555 | $48,100 | $24,900 | $23,200 |
Source: Public Records
Map
Nearby Homes
- 1138 Arkansas Ave
- 1140 Arkansas Ave
- 1235 Arkansas Ave
- 1246 Mississippi Ave
- 1307 Tennessee Ave
- 566 Dorchester Ave
- 1121 Hillsdale Ave
- 1310 Wisconsin Ave
- 1232 Kelton Ave
- 1354 Illinois Ave
- 3065 Latonia Ave
- 2849 Castlegate Ave
- 1407 Hillsdale Ave
- 2848 Ardsley Ave
- 1101 Dormont Ave
- 713 Norwich Ave
- 2960 Glenmore Ave
- 3216 Eastmont Ave
- 522 Woodbourne Ave
- 1233 Biltmore Ave
- 1139 Illinois Ave
- 1133 Illinois Ave
- 1131 Illinois Ave
- 1141 Illinois Ave
- 1127 Illinois Ave
- 1145 Illinois Ave
- 1134 Tennessee Ave
- 1132 Tennessee Ave
- 1136 Illinois Ave
- 1130 Tennessee Ave
- 1142 Tennessee Ave
- 1134 Illinois Ave
- 1138 Illinois Ave Unit 1
- 1138 Illinois Ave Unit 6
- 1138 Illinois Ave
- 1121 Illinois Ave
- 1128 Tennessee Ave
- 1128 Illinois Ave
- 1132 Illinois Ave
- 1130 Illinois Ave