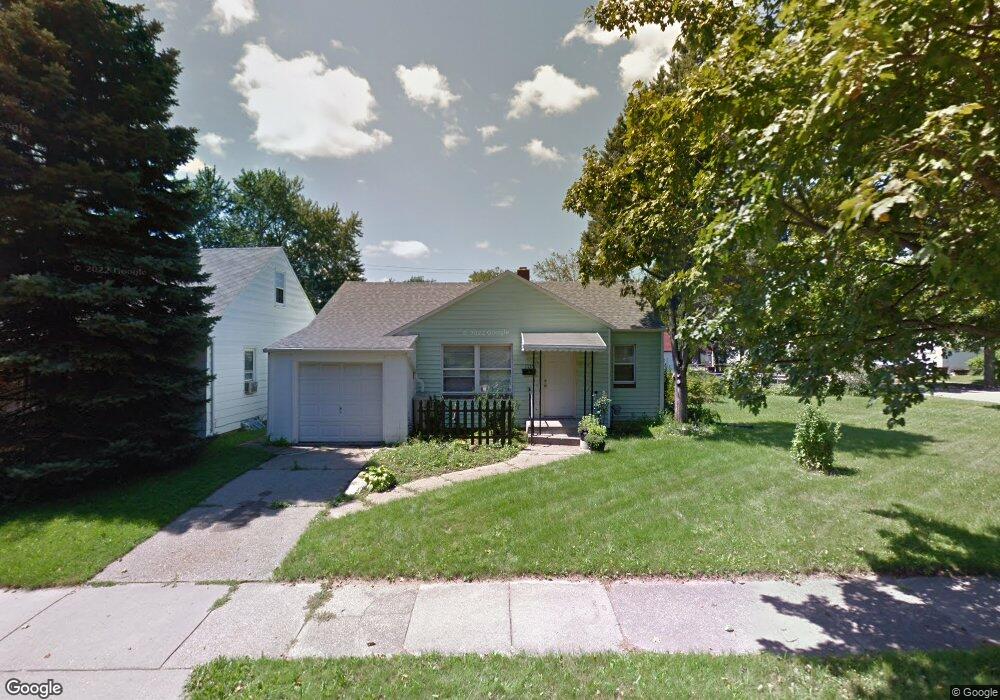
1139 Cawood St Lansing, MI 48915
Old Oakland NeighborhoodEstimated Value: $107,000 - $153,000
3
Beds
1
Bath
2,092
Sq Ft
$66/Sq Ft
Est. Value
About This Home
This home is located at 1139 Cawood St, Lansing, MI 48915 and is currently estimated at $137,558, approximately $65 per square foot. 1139 Cawood St is a home located in Ingham County with nearby schools including Riddle Elementary School, Pattengill Academy, and J.W. Sexton High School.
Ownership History
Date
Name
Owned For
Owner Type
Purchase Details
Closed on
Aug 7, 2009
Sold by
Mortgage Center Llc
Bought by
Peek Cory S
Current Estimated Value
Purchase Details
Closed on
Feb 21, 2008
Sold by
Greenleaf Michael J and Dunscombe Lori R
Bought by
Mortgage Center Llc
Purchase Details
Closed on
Nov 16, 1999
Sold by
Dunscombe Lort
Bought by
Greenleaf Michael J and Dunscombe Lori
Purchase Details
Closed on
Jul 21, 1999
Sold by
The Bank Of New York
Bought by
Dunscombe Lori
Home Financials for this Owner
Home Financials are based on the most recent Mortgage that was taken out on this home.
Original Mortgage
$47,700
Interest Rate
7.7%
Mortgage Type
Purchase Money Mortgage
Purchase Details
Closed on
Jan 8, 1999
Sold by
Callahan Willie M
Bought by
The Bank Of New York
Create a Home Valuation Report for This Property
The Home Valuation Report is an in-depth analysis detailing your home's value as well as a comparison with similar homes in the area
Home Values in the Area
Average Home Value in this Area
Purchase History
| Date | Buyer | Sale Price | Title Company |
|---|---|---|---|
| Peek Cory S | $21,000 | Mortgage Center Title Llc | |
| Mortgage Center Llc | $66,958 | None Available | |
| Greenleaf Michael J | -- | First American Title Ins Co | |
| Dunscombe Lori | $53,000 | First American Title Ins Co | |
| The Bank Of New York | $51,799 | -- |
Source: Public Records
Mortgage History
| Date | Status | Borrower | Loan Amount |
|---|---|---|---|
| Previous Owner | Dunscombe Lori | $47,700 |
Source: Public Records
Tax History Compared to Growth
Tax History
| Year | Tax Paid | Tax Assessment Tax Assessment Total Assessment is a certain percentage of the fair market value that is determined by local assessors to be the total taxable value of land and additions on the property. | Land | Improvement |
|---|---|---|---|---|
| 2025 | $2,156 | $66,900 | $16,900 | $50,000 |
| 2024 | $17 | $55,100 | $16,900 | $38,200 |
| 2023 | $2,023 | $49,800 | $16,900 | $32,900 |
| 2022 | $1,827 | $43,800 | $14,900 | $28,900 |
| 2021 | $1,789 | $40,800 | $13,700 | $27,100 |
| 2020 | $1,778 | $38,600 | $13,700 | $24,900 |
| 2019 | $1,702 | $35,200 | $13,700 | $21,500 |
| 2018 | $1,597 | $32,000 | $13,700 | $18,300 |
| 2017 | $1,529 | $32,000 | $13,700 | $18,300 |
| 2016 | $1,462 | $31,200 | $13,700 | $17,500 |
| 2015 | $1,462 | $30,100 | $27,471 | $2,629 |
| 2014 | $1,462 | $25,400 | $20,000 | $5,400 |
Source: Public Records
Map
Nearby Homes
- 1840 W Maple St
- 1016 Cleo St
- 912 Cleo St
- 1327 N Jenison Ave
- 914 Stanley St
- 821 N Verlinden Ave
- 1310 W Maple St
- 1300 W Maple St
- 819 N Jenison Ave
- 1320 Glenrose Ave
- 1224 Theodore St
- 1432 Redwood St
- 1422 Redwood St
- 751 Westmoreland Ave
- 1620 Comfort St
- 1129 N Martin Luther King jr Blvd
- 908 Clyde St
- 1537 Roselawn Ave
- 1430 N Martin Luther King jr Blvd
- 1019 Daleford St