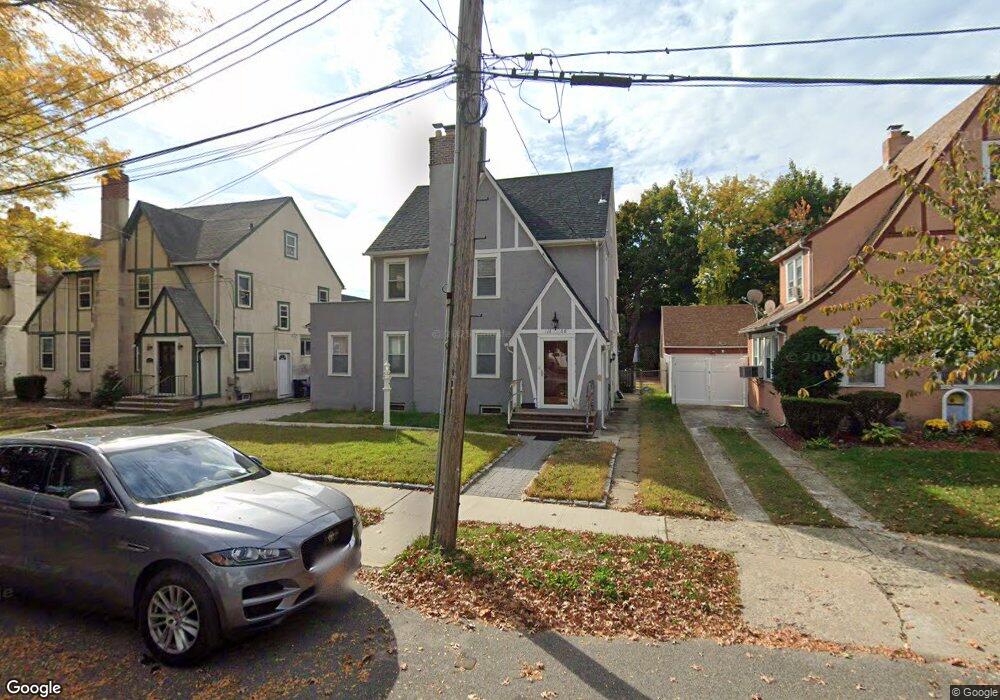
114-68 176th St Jamaica, NY 11434
Saint Albans NeighborhoodEstimated Value: $796,000 - $943,000
4
Beds
3
Baths
2,288
Sq Ft
$389/Sq Ft
Est. Value
About This Home
This home is located at 114-68 176th St, Jamaica, NY 11434 and is currently estimated at $890,899, approximately $389 per square foot. 114-68 176th St is a home located in Queens County with nearby schools including Ps 36 St Albans School, Is 59 Springfield Gardens, and Riverton Street Charter School.
Ownership History
Date
Name
Owned For
Owner Type
Purchase Details
Closed on
Aug 11, 2021
Sold by
Winston Ann and Winston Terrence
Bought by
Winston Ann
Current Estimated Value
Purchase Details
Closed on
Jul 7, 2017
Sold by
Huling Candice and Huling Crispus
Bought by
Winston Ann and Winston Terrence
Home Financials for this Owner
Home Financials are based on the most recent Mortgage that was taken out on this home.
Original Mortgage
$481,379
Outstanding Balance
$400,493
Interest Rate
3.94%
Mortgage Type
Purchase Money Mortgage
Estimated Equity
$490,406
Purchase Details
Closed on
Jun 24, 1998
Sold by
Lister Robert L and Lister Constance M
Bought by
Huling Crispus and Huling Candice
Home Financials for this Owner
Home Financials are based on the most recent Mortgage that was taken out on this home.
Original Mortgage
$169,735
Interest Rate
6.92%
Mortgage Type
FHA
Create a Home Valuation Report for This Property
The Home Valuation Report is an in-depth analysis detailing your home's value as well as a comparison with similar homes in the area
Home Values in the Area
Average Home Value in this Area
Purchase History
| Date | Buyer | Sale Price | Title Company |
|---|---|---|---|
| Winston Ann | -- | -- | |
| Winston Ann | $498,000 | -- | |
| Huling Crispus | $170,000 | -- |
Source: Public Records
Mortgage History
| Date | Status | Borrower | Loan Amount |
|---|---|---|---|
| Open | Winston Ann | $481,379 | |
| Previous Owner | Huling Crispus | $169,735 |
Source: Public Records
Tax History Compared to Growth
Tax History
| Year | Tax Paid | Tax Assessment Tax Assessment Total Assessment is a certain percentage of the fair market value that is determined by local assessors to be the total taxable value of land and additions on the property. | Land | Improvement |
|---|---|---|---|---|
| 2025 | $7,077 | $35,832 | $11,594 | $24,238 |
| 2024 | $7,077 | $35,233 | $11,186 | $24,047 |
| 2023 | $6,738 | $33,546 | $10,060 | $23,486 |
| 2022 | $6,318 | $50,220 | $15,240 | $34,980 |
| 2021 | $6,284 | $44,040 | $15,240 | $28,800 |
| 2020 | $6,320 | $37,860 | $15,240 | $22,620 |
| 2019 | $6,142 | $40,140 | $15,240 | $24,900 |
| 2018 | $5,699 | $27,955 | $9,294 | $18,661 |
| 2017 | $5,077 | $26,374 | $12,027 | $14,347 |
| 2016 | $4,664 | $26,374 | $12,027 | $14,347 |
| 2015 | $2,781 | $24,883 | $14,438 | $10,445 |
| 2014 | $2,781 | $24,468 | $15,131 | $9,337 |
Source: Public Records
Map
Nearby Homes
- 11461 176th St
- 114-88 177th Place
- 11480 178th Place
- 114-18 175th St
- 112-45 178th St
- 11245 178th St
- 11422 174th St
- 112-26 176th St
- 112-13 178th St
- 115-54 174th St
- 179-07 Murdock Ave
- 115-11 180th St
- 17709 112th Ave
- 112- 2 178th St
- 11545 172nd St
- 111-54 178th Place
- 177-08 Sayres Ave
- 17718 Sayres Ave
- 17209 Sayres Ave
- 187-15 Tioga Dr
- 11468 176th St
- 114-74 176th St
- 11474 176th St
- 11462 176th St
- 11478 176th St
- 11469 175th Place
- 114-78 176th St
- 114-78 176th St
- 114-78 176th St
- 11465 175th Place
- 11456 176th St
- 11471 175th Place
- 11457 175th Place
- 11477 175th Place
- 11467 176th St
- 11452 176th St
- 11473 176th St
- 11453 175th Place
- 114-57 176th St
- 11457 176th St