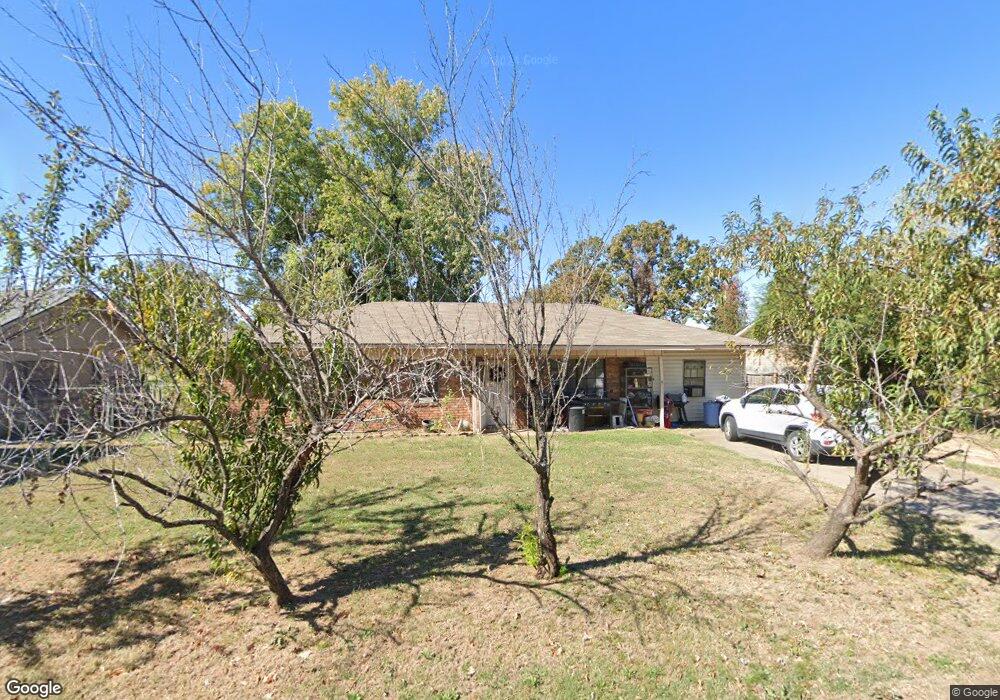
114 S 39th St van Buren, AR 72956
Estimated Value: $131,223 - $161,000
--
Bed
2
Baths
1,485
Sq Ft
$100/Sq Ft
Est. Value
About This Home
This home is located at 114 S 39th St, van Buren, AR 72956 and is currently estimated at $149,056, approximately $100 per square foot. 114 S 39th St is a home located in Crawford County with nearby schools including King Elementary School, Butterfield Trail Middle School, and Van Buren High School.
Ownership History
Date
Name
Owned For
Owner Type
Purchase Details
Closed on
Oct 27, 2005
Sold by
Hyde Larry Edwin and Hyde Etta Faye
Bought by
Gibson Debra Ann and Gibson Allen Bryan
Current Estimated Value
Home Financials for this Owner
Home Financials are based on the most recent Mortgage that was taken out on this home.
Original Mortgage
$53,600
Outstanding Balance
$28,671
Interest Rate
5.75%
Mortgage Type
New Conventional
Estimated Equity
$120,385
Purchase Details
Closed on
Dec 14, 1999
Bought by
Hopper-Hyde
Create a Home Valuation Report for This Property
The Home Valuation Report is an in-depth analysis detailing your home's value as well as a comparison with similar homes in the area
Home Values in the Area
Average Home Value in this Area
Purchase History
| Date | Buyer | Sale Price | Title Company |
|---|---|---|---|
| Gibson Debra Ann | $67,000 | Attorney | |
| Hopper-Hyde | -- | -- |
Source: Public Records
Mortgage History
| Date | Status | Borrower | Loan Amount |
|---|---|---|---|
| Open | Gibson Debra Ann | $53,600 |
Source: Public Records
Tax History Compared to Growth
Tax History
| Year | Tax Paid | Tax Assessment Tax Assessment Total Assessment is a certain percentage of the fair market value that is determined by local assessors to be the total taxable value of land and additions on the property. | Land | Improvement |
|---|---|---|---|---|
| 2025 | $302 | $25,800 | $3,000 | $22,800 |
| 2024 | $363 | $25,800 | $3,000 | $22,800 |
| 2023 | $399 | $25,800 | $3,000 | $22,800 |
| 2022 | $410 | $15,120 | $2,000 | $13,120 |
| 2021 | $410 | $15,120 | $2,000 | $13,120 |
| 2020 | $410 | $15,120 | $2,000 | $13,120 |
| 2019 | $410 | $15,120 | $2,000 | $13,120 |
| 2018 | $435 | $15,120 | $2,000 | $13,120 |
| 2017 | $434 | $15,100 | $2,000 | $13,100 |
| 2016 | $434 | $15,100 | $2,000 | $13,100 |
| 2015 | $388 | $15,100 | $2,000 | $13,100 |
| 2014 | $388 | $15,100 | $2,000 | $13,100 |
Source: Public Records
Map
Nearby Homes