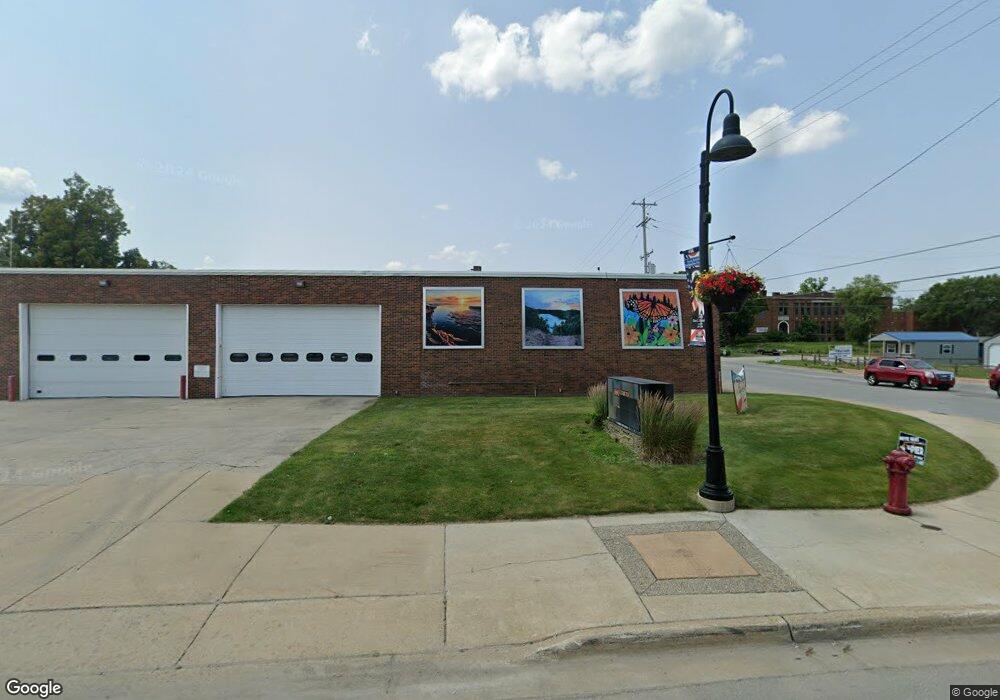
114 S State St Oscoda, MI 48750
Estimated Value: $142,000 - $162,956
2
Beds
1
Bath
890
Sq Ft
$167/Sq Ft
Est. Value
About This Home
This home is located at 114 S State St, Oscoda, MI 48750 and is currently estimated at $148,239, approximately $166 per square foot. 114 S State St is a home located in Iosco County with nearby schools including Richardson Elementary School and Oscoda Area High School.
Ownership History
Date
Name
Owned For
Owner Type
Purchase Details
Closed on
Jul 31, 2025
Sold by
Sullivan Julia Obrien and Sullivan Brian E
Bought by
Roman Christopher Ian
Current Estimated Value
Home Financials for this Owner
Home Financials are based on the most recent Mortgage that was taken out on this home.
Original Mortgage
$108,000
Outstanding Balance
$107,622
Interest Rate
5.8%
Mortgage Type
New Conventional
Estimated Equity
$40,617
Purchase Details
Closed on
Sep 9, 2016
Sold by
Huma Kelly M
Bought by
Sullivan Brian E and Brien Sullivan Jullia O
Home Financials for this Owner
Home Financials are based on the most recent Mortgage that was taken out on this home.
Original Mortgage
$74,800
Interest Rate
3.45%
Mortgage Type
New Conventional
Purchase Details
Closed on
May 26, 2015
Sold by
Glenn Karl J and Glenn Elizabeth A
Bought by
Casey Kelly M
Home Financials for this Owner
Home Financials are based on the most recent Mortgage that was taken out on this home.
Original Mortgage
$75,600
Interest Rate
3.65%
Mortgage Type
New Conventional
Purchase Details
Closed on
Feb 19, 2010
Sold by
Glenn Karl J and Glenn Elizabeth A
Bought by
Glenn Karl J and Glenn Elizabeth A
Create a Home Valuation Report for This Property
The Home Valuation Report is an in-depth analysis detailing your home's value as well as a comparison with similar homes in the area
Home Values in the Area
Average Home Value in this Area
Purchase History
| Date | Buyer | Sale Price | Title Company |
|---|---|---|---|
| Roman Christopher Ian | $144,000 | Landmark Title | |
| Sullivan Brian E | $93,500 | Attorney | |
| Casey Kelly M | $84,000 | Attorney | |
| Glenn Karl J | -- | -- |
Source: Public Records
Mortgage History
| Date | Status | Borrower | Loan Amount |
|---|---|---|---|
| Open | Roman Christopher Ian | $108,000 | |
| Previous Owner | Sullivan Brian E | $74,800 | |
| Previous Owner | Casey Kelly M | $75,600 |
Source: Public Records
Tax History Compared to Growth
Tax History
| Year | Tax Paid | Tax Assessment Tax Assessment Total Assessment is a certain percentage of the fair market value that is determined by local assessors to be the total taxable value of land and additions on the property. | Land | Improvement |
|---|---|---|---|---|
| 2025 | $2,347 | $58,200 | $58,200 | $0 |
| 2024 | $2,044 | $55,000 | $0 | $0 |
| 2023 | $1,419 | $47,300 | $47,300 | $0 |
| 2022 | $1,887 | $43,800 | $43,800 | $0 |
| 2021 | $1,930 | $47,500 | $47,500 | $0 |
| 2020 | $1,876 | $47,900 | $47,900 | $0 |
| 2019 | $1,852 | $47,000 | $47,000 | $0 |
| 2018 | $1,812 | $44,600 | $44,600 | $0 |
| 2017 | $1,685 | $41,400 | $41,400 | $0 |
| 2016 | $902 | $41,400 | $0 | $0 |
| 2015 | -- | $43,800 | $0 | $0 |
| 2014 | -- | $42,400 | $0 | $0 |
| 2013 | -- | $43,600 | $0 | $0 |
Source: Public Records
Map
Nearby Homes
- 241 Smith St
- 909 Farnsworth St
- 112 1st St N
- 430 S State St
- 891 S State St
- 879 S State St
- 4135 Forest Rd
- 4699 Johnson Rd
- 411 Ottawa Dr
- 4900 Melody St
- 3734 U S 23
- VL Vaughan Trail
- 0 Vl Vaughn Trail
- 5320 Pine St
- 5300 Cedar Lake Rd
- 3497 U S 23
- 5484 Cedar Lake Rd
- 4451 Bissonette Rd
- 8207 Florida Unit A Common
- 5614 Cedar Lake Rd
- 114 S State St Unit 4
- 114 S State St Unit 3
- 114 S State St
- 114 S State St
- 114 S State St
- 114 S State St
- 114 S State St
- 229 State St SW
- 239 State St SW
- 249 State St SW
- 219 State St SW
- 210 State St SW
- 259 State St SW
- 240 State St SW
- 108 Stockman St
- 514 1st St N
- 269 State St SW
- 518 1st St N
- 313 State St SW
- 230 State St SW