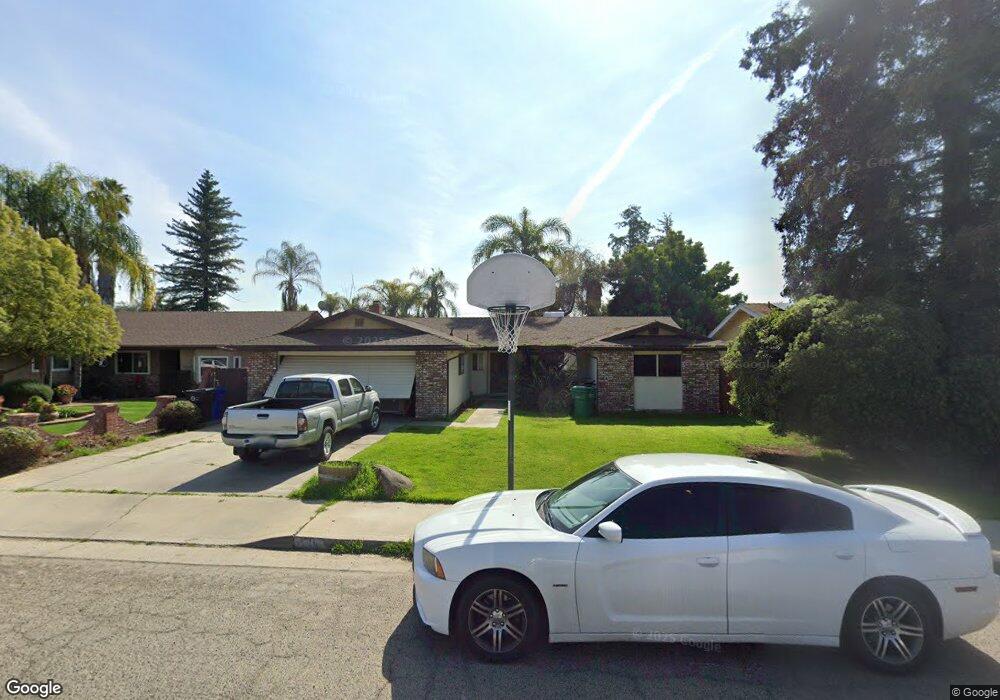
1141 Sandra Ave Porterville, CA 93257
Porterville Northwest NeighborhoodEstimated Value: $338,993 - $372,000
3
Beds
2
Baths
1,599
Sq Ft
$222/Sq Ft
Est. Value
About This Home
This home is located at 1141 Sandra Ave, Porterville, CA 93257 and is currently estimated at $354,248, approximately $221 per square foot. 1141 Sandra Ave is a home located in Tulare County with nearby schools including Westfield Elementary School, Sequoia Middle School, and Monache High School.
Ownership History
Date
Name
Owned For
Owner Type
Purchase Details
Closed on
Aug 20, 2001
Sold by
Wilson William D
Bought by
Martinez Stephen R and Martinez Aurora
Current Estimated Value
Home Financials for this Owner
Home Financials are based on the most recent Mortgage that was taken out on this home.
Original Mortgage
$114,973
Outstanding Balance
$44,330
Interest Rate
6.99%
Mortgage Type
FHA
Estimated Equity
$309,918
Purchase Details
Closed on
May 28, 1997
Sold by
Bonney Dean R
Bought by
Wilson William D and Wilson Lisa L
Home Financials for this Owner
Home Financials are based on the most recent Mortgage that was taken out on this home.
Original Mortgage
$109,663
Interest Rate
7.98%
Mortgage Type
FHA
Purchase Details
Closed on
Aug 21, 1995
Sold by
Barber Diana K
Bought by
Bonney Dean R and Bonney Kori L
Home Financials for this Owner
Home Financials are based on the most recent Mortgage that was taken out on this home.
Original Mortgage
$110,941
Interest Rate
7.92%
Mortgage Type
FHA
Create a Home Valuation Report for This Property
The Home Valuation Report is an in-depth analysis detailing your home's value as well as a comparison with similar homes in the area
Home Values in the Area
Average Home Value in this Area
Purchase History
| Date | Buyer | Sale Price | Title Company |
|---|---|---|---|
| Martinez Stephen R | $116,000 | First American Title Co | |
| Wilson William D | $110,500 | First American Title Ins Co | |
| Bonney Dean R | $114,000 | Chicago Title Co |
Source: Public Records
Mortgage History
| Date | Status | Borrower | Loan Amount |
|---|---|---|---|
| Open | Martinez Stephen R | $114,973 | |
| Previous Owner | Wilson William D | $109,663 | |
| Previous Owner | Bonney Dean R | $110,941 |
Source: Public Records
Tax History Compared to Growth
Tax History
| Year | Tax Paid | Tax Assessment Tax Assessment Total Assessment is a certain percentage of the fair market value that is determined by local assessors to be the total taxable value of land and additions on the property. | Land | Improvement |
|---|---|---|---|---|
| 2025 | $1,820 | $171,375 | $41,367 | $130,008 |
| 2024 | $1,820 | $168,015 | $40,556 | $127,459 |
| 2023 | $1,819 | $164,721 | $39,761 | $124,960 |
| 2022 | $1,762 | $161,492 | $38,982 | $122,510 |
| 2021 | $1,742 | $158,326 | $38,218 | $120,108 |
| 2020 | $1,723 | $156,702 | $37,826 | $118,876 |
| 2019 | $1,692 | $153,629 | $37,084 | $116,545 |
| 2018 | $1,662 | $150,617 | $36,357 | $114,260 |
| 2017 | $1,621 | $147,664 | $35,644 | $112,020 |
| 2016 | $1,556 | $144,769 | $34,945 | $109,824 |
| 2015 | $1,496 | $142,594 | $34,420 | $108,174 |
| 2014 | $1,496 | $139,801 | $33,746 | $106,055 |
Source: Public Records
Map
Nearby Homes
- 1045 N Westside St
- 1076 N Beverly St
- 1245 Atkins St
- 700 N Prospect St
- 1089 Pioneer Ave
- 1121 N Lindale Way
- 640 N Prospect St
- 1370 Lindale Place
- 1041 Greenfield Dr
- 1421 Pamela Cir
- 681 W Mulberry Ave
- 829 Pioneer Ave
- 680 W Gerry Cir
- 793 Pioneer Ave
- 701 W Theta Ave
- 701 Theta Ave
- 927 Shadowood Place
- 1644 Mccomb Ave
- 816 W Grand Ave
- 1681 W Wall Ln
- 1141 Sandra Ave
- 1151 Sandra Ave
- 1131 Sandra Ave
- 1131 Sandra Ave
- 1140 W Mulberry Ave
- 1121 Sandra Ave
- 1171 Sandra Ave
- 1121 Sandra Ave
- 1150 W Mulberry Ave
- 1056 N Maston St
- 1055 Douglas St
- 1120 W Mulberry Ave
- 1170 W Mulberry Ave
- 1111 Sandra Ave
- 1066 N Maston St
- 1110 W Mulberry Ave
- 1065 Douglas St
- 1055 N Maston St
- 1026 N Prospect St
- 1050 Douglas St