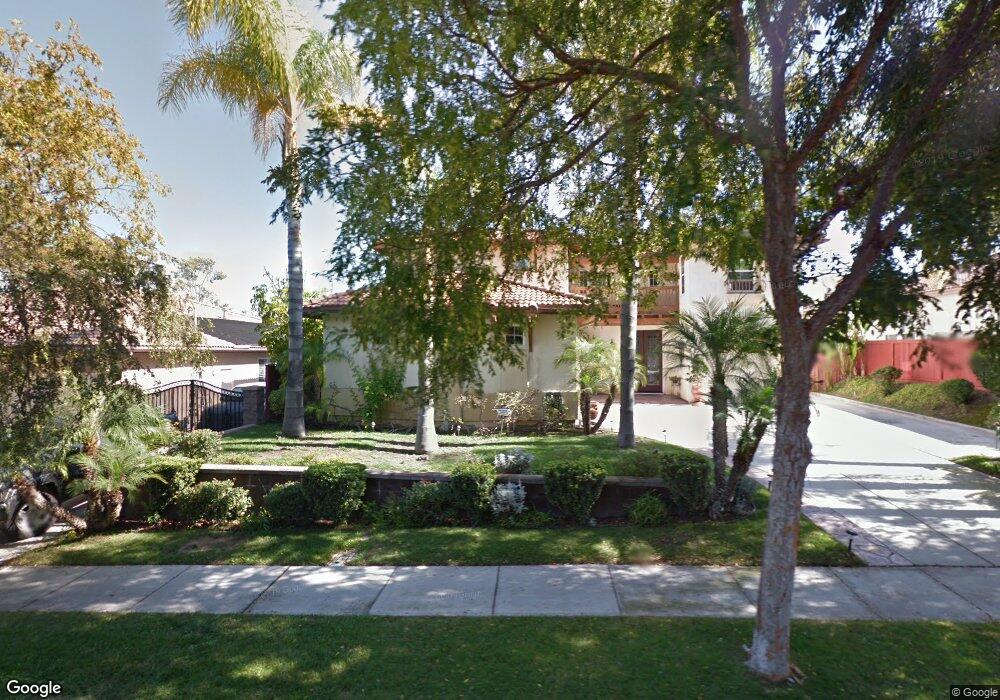
1143 Santa Delphina Ave Chula Vista, CA 91913
Otay Ranch Village NeighborhoodEstimated Value: $1,223,955 - $1,351,000
6
Beds
3
Baths
3,206
Sq Ft
$408/Sq Ft
Est. Value
About This Home
This home is located at 1143 Santa Delphina Ave, Chula Vista, CA 91913 and is currently estimated at $1,308,989, approximately $408 per square foot. 1143 Santa Delphina Ave is a home located in San Diego County with nearby schools including Heritage Elementary School, Rancho Del Rey Middle School, and Otay Ranch Senior High School.
Ownership History
Date
Name
Owned For
Owner Type
Purchase Details
Closed on
Oct 22, 2020
Sold by
Adams Kenneth D and Adams Maria Patricia
Bought by
Adams Kenneth D
Current Estimated Value
Home Financials for this Owner
Home Financials are based on the most recent Mortgage that was taken out on this home.
Original Mortgage
$455,800
Outstanding Balance
$404,671
Interest Rate
2.8%
Mortgage Type
New Conventional
Estimated Equity
$904,318
Purchase Details
Closed on
Jul 11, 2019
Sold by
Payne Arthur Y and Bryan Payne Darlene S
Bought by
Adams Kenneth D and Mejia Maria Patricia
Home Financials for this Owner
Home Financials are based on the most recent Mortgage that was taken out on this home.
Original Mortgage
$450,000
Interest Rate
3.12%
Mortgage Type
Adjustable Rate Mortgage/ARM
Purchase Details
Closed on
Mar 7, 2000
Sold by
Otay Alcala-120 L L C
Bought by
Payne Arthur Y and Bryan Payne Darlene S
Home Financials for this Owner
Home Financials are based on the most recent Mortgage that was taken out on this home.
Original Mortgage
$252,700
Interest Rate
8.67%
Create a Home Valuation Report for This Property
The Home Valuation Report is an in-depth analysis detailing your home's value as well as a comparison with similar homes in the area
Home Values in the Area
Average Home Value in this Area
Purchase History
| Date | Buyer | Sale Price | Title Company |
|---|---|---|---|
| Adams Kenneth D | -- | Ticor Title Company | |
| Adams Kenneth D | $731,000 | Ticor Title Company | |
| Payne Arthur Y | $361,000 | First American Title |
Source: Public Records
Mortgage History
| Date | Status | Borrower | Loan Amount |
|---|---|---|---|
| Open | Adams Kenneth D | $455,800 | |
| Closed | Adams Kenneth D | $450,000 | |
| Previous Owner | Payne Arthur Y | $252,700 | |
| Closed | Payne Arthur Y | $36,000 |
Source: Public Records
Tax History Compared to Growth
Tax History
| Year | Tax Paid | Tax Assessment Tax Assessment Total Assessment is a certain percentage of the fair market value that is determined by local assessors to be the total taxable value of land and additions on the property. | Land | Improvement |
|---|---|---|---|---|
| 2025 | $10,226 | $799,449 | $393,710 | $405,739 |
| 2024 | $10,226 | $783,775 | $385,991 | $397,784 |
| 2023 | $12,685 | $768,408 | $378,423 | $389,985 |
| 2022 | $12,309 | $753,342 | $371,003 | $382,339 |
| 2021 | $12,137 | $738,572 | $363,729 | $374,843 |
| 2020 | $11,865 | $731,000 | $360,000 | $371,000 |
| 2019 | $9,144 | $497,241 | $137,776 | $359,465 |
| 2018 | $8,998 | $487,492 | $135,075 | $352,417 |
| 2017 | $13 | $477,934 | $132,427 | $345,507 |
| 2016 | $8,634 | $468,564 | $129,831 | $338,733 |
| 2015 | $8,537 | $461,526 | $127,881 | $333,645 |
| 2014 | $8,526 | $452,486 | $125,376 | $327,110 |
Source: Public Records
Map
Nearby Homes
- 1781 Camino Strava Unit 1
- 1711 Avenida Tealing
- 1719 Avenida Tealing Unit 2
- 1153 Gustine St
- 1757 Via Capri
- 1272 Santa Lucia Rd
- 1760 E Palomar St Unit 318
- 1236 Bolinas Bay Ct
- 1777 Clover Tree Ct
- 1529 Apache Dr Unit A
- 1631 Applegate St
- 1579 Apache Dr Unit E
- 779 Caminito Francisco Unit 1
- 1863 Meeks Bay Dr
- 1401 Caminito Capistrano Unit 1
- 1279 Fools Gold Way Unit 2
- 1285 Fools Gold Way Unit 2
- 1402 Antioch Ave
- 1518 Piedmont St
- 1873 Fargo Ln Unit 4
- 1147 Santa Delphina Ave
- 1139 Santa Delphina Ave
- 1138 Bellena Ave
- 1142 Bellena Ave Unit 1
- 1134 Bellena Ave
- 1144 Santa Delphina Ave
- 1146 Bellena Ave Unit 1
- 1140 Santa Delphina Ave
- 1148 Santa Delphina Ave
- 1136 Santa Delphina Ave
- 1150 Bellena Ave
- 1155 Santa Delphina Ave
- 1152 Santa Delphina Ave Unit 1
- 1132 Santa Delphina Ave
- 1639 Bellena Ct Unit 1
- 1640 Bellena Ct
- 1145 Pacifica Ave
- 1149 Pacifica Ave
- 1154 Bellena Ave Unit 1
- 1137 Pacifica Ave Unit 1