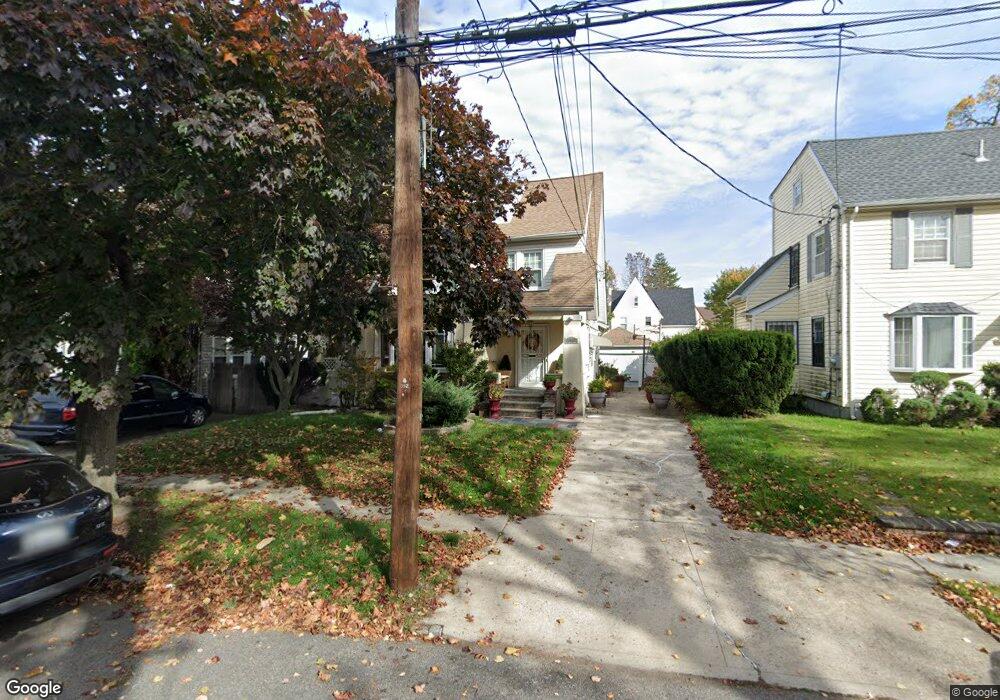
11439 175th St Jamaica, NY 11434
Saint Albans NeighborhoodEstimated Value: $720,591 - $907,000
--
Bed
--
Bath
1,801
Sq Ft
$452/Sq Ft
Est. Value
About This Home
This home is located at 11439 175th St, Jamaica, NY 11434 and is currently estimated at $814,898, approximately $452 per square foot. 11439 175th St is a home located in Queens County with nearby schools including Ps 36 St Albans School, Is 59 Springfield Gardens, and Riverton Street Charter School.
Ownership History
Date
Name
Owned For
Owner Type
Purchase Details
Closed on
May 2, 2025
Sold by
Stoll Sandra
Bought by
Sandra A Stoll Revocable Living Trust and Sandra A Stoll Trustee
Current Estimated Value
Purchase Details
Closed on
Jan 17, 2007
Sold by
Stoll Denise and Stoll Sandra
Bought by
Stoll Sandra
Purchase Details
Closed on
Dec 16, 2002
Sold by
Anderson Greeta Gainer
Bought by
Stoll Denise and Stoll Sandra
Purchase Details
Closed on
Jun 26, 2002
Sold by
Federal National Mortgage Association
Bought by
Anderson Greta Gainer
Home Financials for this Owner
Home Financials are based on the most recent Mortgage that was taken out on this home.
Original Mortgage
$157,500
Interest Rate
6.61%
Mortgage Type
Purchase Money Mortgage
Purchase Details
Closed on
Aug 3, 2001
Sold by
Persha Barbara Emmanuel and Gittens Vincent
Bought by
Federal National Mortgag
Create a Home Valuation Report for This Property
The Home Valuation Report is an in-depth analysis detailing your home's value as well as a comparison with similar homes in the area
Home Values in the Area
Average Home Value in this Area
Purchase History
| Date | Buyer | Sale Price | Title Company |
|---|---|---|---|
| Sandra A Stoll Revocable Living Trust | -- | -- | |
| Stoll Sandra | -- | -- | |
| Stoll Sandra | -- | -- | |
| Stoll Denise | $304,500 | -- | |
| Stoll Denise | $304,500 | -- | |
| Anderson Greta Gainer | -- | -- | |
| Anderson Greta Gainer | -- | -- | |
| Federal National Mortgag | -- | -- | |
| Federal National Mortgag | -- | -- |
Source: Public Records
Mortgage History
| Date | Status | Borrower | Loan Amount |
|---|---|---|---|
| Previous Owner | Anderson Greta Gainer | $157,500 | |
| Closed | Stoll Denise | $0 |
Source: Public Records
Tax History Compared to Growth
Tax History
| Year | Tax Paid | Tax Assessment Tax Assessment Total Assessment is a certain percentage of the fair market value that is determined by local assessors to be the total taxable value of land and additions on the property. | Land | Improvement |
|---|---|---|---|---|
| 2025 | $6,541 | $32,890 | $10,346 | $22,544 |
| 2024 | $6,541 | $32,567 | $9,891 | $22,676 |
| 2023 | $6,175 | $30,742 | $8,627 | $22,115 |
| 2022 | $5,793 | $40,800 | $13,740 | $27,060 |
| 2021 | $5,768 | $39,780 | $13,740 | $26,040 |
| 2020 | $5,801 | $34,200 | $13,740 | $20,460 |
| 2019 | $5,677 | $34,020 | $13,740 | $20,280 |
| 2018 | $5,222 | $25,618 | $9,601 | $16,017 |
| 2017 | $4,930 | $24,184 | $11,076 | $13,108 |
| 2016 | $4,566 | $24,184 | $11,076 | $13,108 |
| 2015 | $2,532 | $22,840 | $12,239 | $10,601 |
| 2014 | $2,532 | $22,616 | $13,297 | $9,319 |
Source: Public Records
Map
Nearby Homes
- 114-18 175th St
- 11422 174th St
- 11461 176th St
- 112-26 176th St
- 115-54 174th St
- 11545 172nd St
- 114-88 177th Place
- 17209 Sayres Ave
- 112-45 178th St
- 11245 178th St
- 11480 178th Place
- 17709 112th Ave
- 112-13 178th St
- 168-14 115th Ave
- 17210 111th Ave
- 16917 116th Ave
- 172-18 111th Ave
- 177-08 Sayres Ave
- 112-35 168th St
- 112- 2 178th St
- 114-53 175 St
- 11435 175th St
- 11445 175th St
- 11442 175th Place
- 11446 175th Place
- 11447 175th St
- 114-46 175th Place
- 114-46 175th Place
- 114-46 175th Place
- 114-46 175th Place
- 114-46 175th Place
- 114-46 175th Place
- 17506 Linden Blvd
- 11442 175th Place
- 11438 175th Place
- 11450 175th Place
- 11438 175th Place
- 114-38 175th Place
- 11434 175th Place
- 11418 175th St