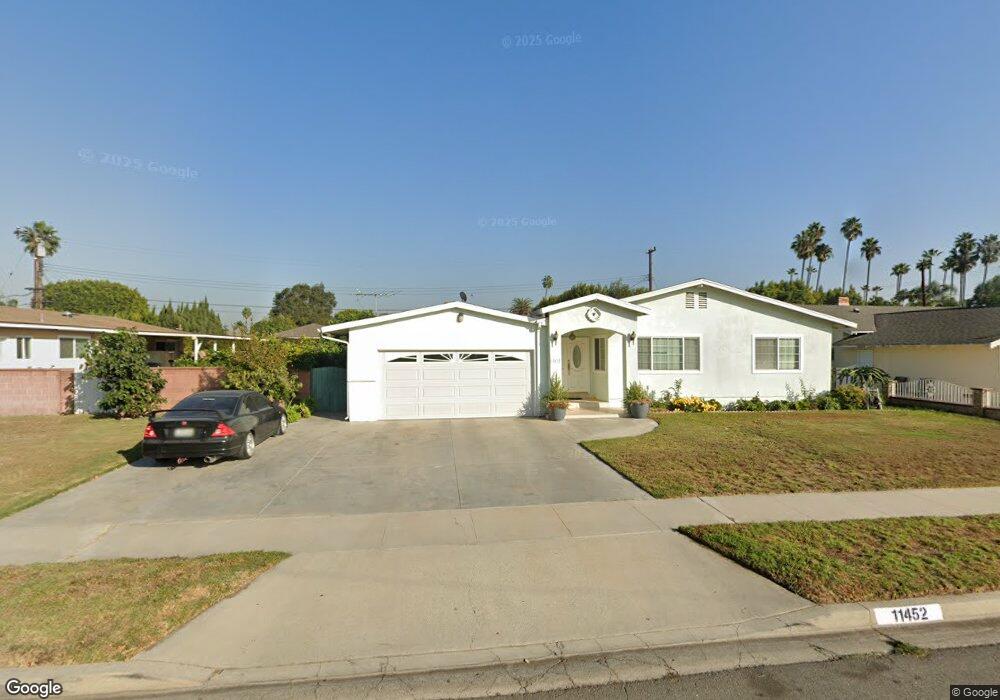
11452 Desmond St Garden Grove, CA 92841
Estimated Value: $1,084,000 - $1,295,931
3
Beds
3
Baths
1,586
Sq Ft
$747/Sq Ft
Est. Value
About This Home
This home is located at 11452 Desmond St, Garden Grove, CA 92841 and is currently estimated at $1,184,733, approximately $746 per square foot. 11452 Desmond St is a home located in Orange County with nearby schools including Gilbert Elementary School, Lake Intermediate School, and Rancho Alamitos High School.
Ownership History
Date
Name
Owned For
Owner Type
Purchase Details
Closed on
Aug 27, 2018
Sold by
Vanvannguyen Ban Van and Vanvannguyen Ngoc Le
Bought by
Vanvannguyen Ban Van and Thi Le Ngoc Cam
Current Estimated Value
Purchase Details
Closed on
Dec 17, 1999
Sold by
Merassa Diane Mary
Bought by
Merassa Shawn Afshang
Home Financials for this Owner
Home Financials are based on the most recent Mortgage that was taken out on this home.
Original Mortgage
$80,000
Interest Rate
7.72%
Purchase Details
Closed on
Jan 17, 1996
Sold by
Mohammad Mehrassa and Mohammad Behjat
Bought by
Merassa Shawn Afshang
Purchase Details
Closed on
Mar 17, 1994
Sold by
Mehrassa Mohammad Ali and Mehrassa Behjat B
Bought by
Mehrassa Mohammad Ali and Mehrassa Behjat B
Create a Home Valuation Report for This Property
The Home Valuation Report is an in-depth analysis detailing your home's value as well as a comparison with similar homes in the area
Home Values in the Area
Average Home Value in this Area
Purchase History
| Date | Buyer | Sale Price | Title Company |
|---|---|---|---|
| Vanvannguyen Ban Van | -- | None Available | |
| Vanvannguyen Ban Van | -- | None Available | |
| Merassa Shawn Afshang | -- | First American Title Ins Co | |
| Vanvannguyen Ban Van | $232,000 | First American Title Ins Co | |
| Merassa Shawn Afshang | -- | First American Title Ins Co | |
| Mehrassa Mohammad Ali | -- | -- |
Source: Public Records
Mortgage History
| Date | Status | Borrower | Loan Amount |
|---|---|---|---|
| Closed | Vanvannguyen Ban Van | $80,000 |
Source: Public Records
Tax History Compared to Growth
Tax History
| Year | Tax Paid | Tax Assessment Tax Assessment Total Assessment is a certain percentage of the fair market value that is determined by local assessors to be the total taxable value of land and additions on the property. | Land | Improvement |
|---|---|---|---|---|
| 2025 | $5,986 | $485,792 | $254,230 | $231,562 |
| 2024 | $5,986 | $476,267 | $249,245 | $227,022 |
| 2023 | $5,874 | $466,929 | $244,358 | $222,571 |
| 2022 | $5,787 | $457,774 | $239,567 | $218,207 |
| 2021 | $5,729 | $448,799 | $234,870 | $213,929 |
| 2020 | $5,665 | $444,198 | $232,462 | $211,736 |
| 2019 | $5,526 | $435,489 | $227,904 | $207,585 |
| 2018 | $5,353 | $426,950 | $223,435 | $203,515 |
| 2017 | $5,279 | $418,579 | $219,054 | $199,525 |
| 2016 | $5,016 | $410,372 | $214,759 | $195,613 |
| 2015 | $4,952 | $404,208 | $211,533 | $192,675 |
| 2014 | $4,782 | $396,291 | $207,390 | $188,901 |
Source: Public Records
Map
Nearby Homes
- 9262 Joyzelle Dr
- 11432 Pollard Dr
- 9041 Shelley Dr
- 11691 Faun Ln
- 11172 Homeway Dr
- 11222 Magnolia St
- 9371 Cellini Ave
- 11841 Magnolia St
- 11421 Barclay Dr
- 8732 Orangewood Ave
- 8952 Poinsettia Ln
- 12071 Marlowe Dr
- 9592 Katella Ave
- 9762 Gamble Ave
- 11251 Bowles Ave
- 9901 Royal Palm Blvd
- 90093 Stacie Ln
- 9041 Stacie Ln Unit 12
- 9881 Aldgate Ave
- 8681 Katella Ave
- 11472 Desmond St
- 9202 Oma Place
- 11451 Gill Dr
- 11431 Gill Dr
- 11451 Desmond St
- 11441 Desmond St
- 11471 Desmond St
- 11421 Desmond St
- 9202 Orangewood Ave
- 9191 Oma Place
- 9201 Oma Place
- 9181 Oma Place
- 9260 Royal Palm Blvd
- 11462 Gill Dr
- 11442 Homeway Dr
- 9211 Oma Place
- 11452 Homeway Dr
- 11472 Gill Dr
- 11442 Gill Dr
- 11472 Homeway Dr