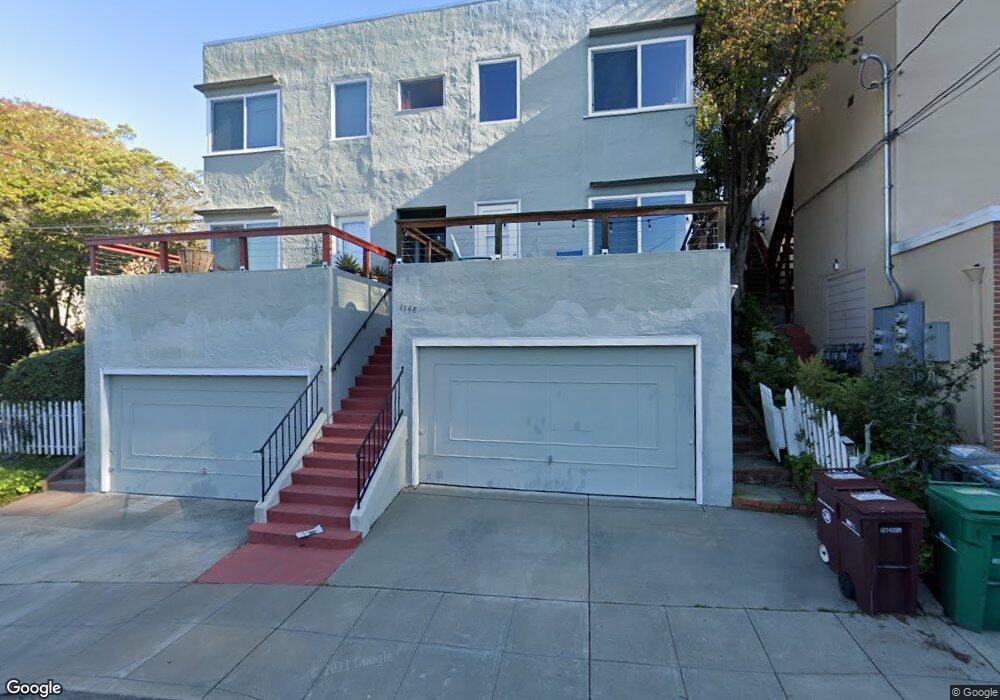
1148 Norwood Ave Oakland, CA 94610
Trestle Glen NeighborhoodEstimated Value: $1,342,000 - $2,420,814
1
Bed
1
Bath
--
Sq Ft
3,746
Sq Ft Lot
About This Home
This home is located at 1148 Norwood Ave, Oakland, CA 94610 and is currently estimated at $1,932,454. 1148 Norwood Ave is a home located in Alameda County with nearby schools including Glenview Elementary School, Edna Brewer Middle School, and Oakland High School.
Ownership History
Date
Name
Owned For
Owner Type
Purchase Details
Closed on
Aug 2, 2021
Sold by
Chow Dora
Bought by
Chow Dora Siu Ying and 2021 Dora Siu
Current Estimated Value
Purchase Details
Closed on
Nov 20, 2012
Sold by
Chinn Darryl C and Chinn Alice H
Bought by
Chow Dora
Home Financials for this Owner
Home Financials are based on the most recent Mortgage that was taken out on this home.
Original Mortgage
$682,500
Outstanding Balance
$470,279
Interest Rate
3.33%
Mortgage Type
New Conventional
Estimated Equity
$1,462,175
Purchase Details
Closed on
Jan 18, 2007
Sold by
Lee Stephen F and Lee Suzanne C
Bought by
Lee Stephen F
Purchase Details
Closed on
Mar 22, 2002
Sold by
Chinn Darryl C and Chinn Alice H
Bought by
Chinn Darryl C and Chinn Alice H
Purchase Details
Closed on
Jun 29, 2000
Sold by
Lee Stephen F
Bought by
Lee Stephen F and Lee Suzanne C
Create a Home Valuation Report for This Property
The Home Valuation Report is an in-depth analysis detailing your home's value as well as a comparison with similar homes in the area
Home Values in the Area
Average Home Value in this Area
Purchase History
| Date | Buyer | Sale Price | Title Company |
|---|---|---|---|
| Chow Dora Siu Ying | -- | None Available | |
| Chow Dora | $910,000 | Chicago Title Company | |
| Lee Stephen F | -- | None Available | |
| Chinn Darryl C | -- | -- | |
| Chinn Darryl C | -- | -- | |
| Lee Stephen F | -- | -- |
Source: Public Records
Mortgage History
| Date | Status | Borrower | Loan Amount |
|---|---|---|---|
| Open | Chow Dora | $682,500 |
Source: Public Records
Tax History Compared to Growth
Tax History
| Year | Tax Paid | Tax Assessment Tax Assessment Total Assessment is a certain percentage of the fair market value that is determined by local assessors to be the total taxable value of land and additions on the property. | Land | Improvement |
|---|---|---|---|---|
| 2025 | $17,525 | $1,108,241 | $332,472 | $775,769 |
| 2024 | $17,525 | $1,086,515 | $325,954 | $760,561 |
| 2023 | $18,324 | $1,065,212 | $319,563 | $745,649 |
| 2022 | $17,664 | $1,044,332 | $313,299 | $731,033 |
| 2021 | $16,672 | $1,023,857 | $307,157 | $716,700 |
| 2020 | $16,482 | $1,013,363 | $304,009 | $709,354 |
| 2019 | $15,717 | $993,500 | $298,050 | $695,450 |
| 2018 | $15,385 | $974,024 | $292,207 | $681,817 |
| 2017 | $14,723 | $954,926 | $286,478 | $668,448 |
| 2016 | $14,332 | $936,206 | $280,862 | $655,344 |
| 2015 | $14,258 | $922,148 | $276,644 | $645,504 |
| 2014 | $14,800 | $904,085 | $271,225 | $632,860 |
Source: Public Records
Map
Nearby Homes
- 1107 Wellington St
- 1233 Hampel St
- 1235 Hampel St
- 4426 Park Blvd
- 1415 Trestle Glen Rd
- 3945 Randolph Ave Unit 2
- 1515 Hampel St
- 1059 El Centro Ave Unit 3
- 1006 Glendora Ave
- 1200 El Centro Ave
- 3937 Greenwood Ave
- 1297 Sunnyhills Rd
- 1621 E 38th St
- 542 Midcrest Rd
- 1073 Mandana Blvd
- 22 Valant Place
- 2 Cavendish Ln
- 1124 Hollywood Ave Unit 3
- 953 Grosvenor Place
- 1158 Norwood Ave
- 1134 Norwood Ave
- 1163 Wellington St
- 1169 Wellington St
- 1149 Norwood Ave
- 1151 Wellington St
- 1141 Norwood Ave
- 1175 Wellington St
- 1124 Norwood Ave
- 1127 Norwood Ave Unit 1127
- 1129 Norwood Ave
- 1145 Wellington St
- 1131 Norwood Ave Unit 1131
- 1201 Wellington St
- 1123 Norwood Ave
- 1114 Norwood Ave
- 1139 Wellington St
- 1207 Wellington St
- 4157 Greenwood Ave
- 1115 Norwood Ave