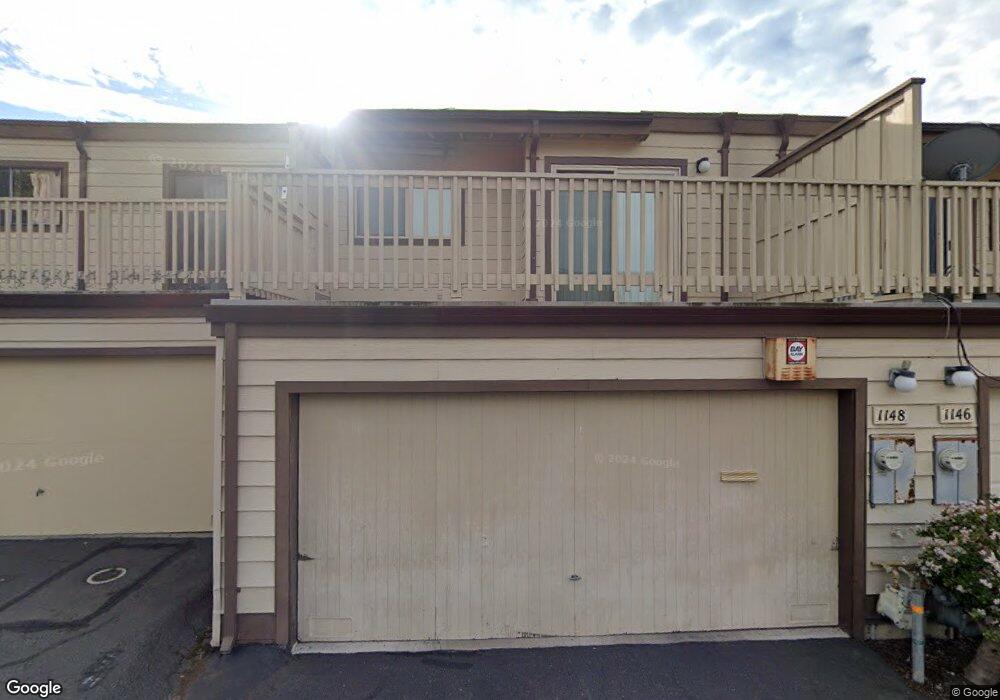
1148 Richmond St El Cerrito, CA 94530
Estimated Value: $620,000 - $815,000
3
Beds
3
Baths
1,330
Sq Ft
$521/Sq Ft
Est. Value
About This Home
This home is located at 1148 Richmond St, El Cerrito, CA 94530 and is currently estimated at $693,393, approximately $521 per square foot. 1148 Richmond St is a home located in Contra Costa County with nearby schools including Madera Elementary School, Fred T. Korematsu Middle School, and El Cerrito Senior High School.
Ownership History
Date
Name
Owned For
Owner Type
Purchase Details
Closed on
May 18, 2023
Sold by
Britton Etta Lee
Bought by
Etta Lee Britton Revocable Living Trust and Britton
Current Estimated Value
Purchase Details
Closed on
Feb 15, 2012
Sold by
Grabowski James R and Flannery Brigit
Bought by
Dickens Khadija A and Britton Etta L
Home Financials for this Owner
Home Financials are based on the most recent Mortgage that was taken out on this home.
Original Mortgage
$192,000
Interest Rate
3.84%
Mortgage Type
New Conventional
Purchase Details
Closed on
Feb 16, 2005
Sold by
Thorsen James M
Bought by
Grabowski James R and Flannery Brigit
Home Financials for this Owner
Home Financials are based on the most recent Mortgage that was taken out on this home.
Original Mortgage
$45,000
Interest Rate
5.66%
Mortgage Type
Credit Line Revolving
Create a Home Valuation Report for This Property
The Home Valuation Report is an in-depth analysis detailing your home's value as well as a comparison with similar homes in the area
Home Values in the Area
Average Home Value in this Area
Purchase History
| Date | Buyer | Sale Price | Title Company |
|---|---|---|---|
| Etta Lee Britton Revocable Living Trust | -- | None Listed On Document | |
| Britton Etta Lee | -- | None Listed On Document | |
| Dickens Khadija A | $240,000 | Old Republic Title Company | |
| Grabowski James R | $450,000 | Fidelity National Title |
Source: Public Records
Mortgage History
| Date | Status | Borrower | Loan Amount |
|---|---|---|---|
| Previous Owner | Dickens Khadija A | $192,000 | |
| Previous Owner | Grabowski James R | $45,000 | |
| Previous Owner | Grabowski James R | $360,000 |
Source: Public Records
Tax History Compared to Growth
Tax History
| Year | Tax Paid | Tax Assessment Tax Assessment Total Assessment is a certain percentage of the fair market value that is determined by local assessors to be the total taxable value of land and additions on the property. | Land | Improvement |
|---|---|---|---|---|
| 2025 | $7,606 | $514,859 | $314,118 | $200,741 |
| 2024 | $4,757 | $504,764 | $307,959 | $196,805 |
| 2023 | $4,757 | $289,736 | $173,842 | $115,894 |
| 2022 | $4,662 | $284,056 | $170,434 | $113,622 |
| 2021 | $4,616 | $278,488 | $167,093 | $111,395 |
| 2019 | $4,319 | $270,230 | $162,138 | $108,092 |
| 2018 | $4,166 | $264,932 | $158,959 | $105,973 |
| 2017 | $4,105 | $259,739 | $155,843 | $103,896 |
| 2016 | $4,083 | $254,647 | $152,788 | $101,859 |
| 2015 | $4,093 | $250,822 | $150,493 | $100,329 |
| 2014 | $4,058 | $245,910 | $147,546 | $98,364 |
Source: Public Records
Map
Nearby Homes
- 1130 Richmond St
- 1213 Richmond St
- 1225 Richmond St
- 1225 Elm St
- 1244 Liberty St
- 1029 Ranchito Ct
- 1330 Elm St
- 951 Lexington Ave
- 6727 Waldo Ave
- 1034 Navellier St
- 10496 San Pablo Ave
- 5955 Wenk Ave
- 10280 San Pablo Ave
- 7788 Moeser Ln
- 1623 Butte St
- 876 Balra Dr
- 6124 Santa Cruz Ave
- 5801 Madison Ave
- 6910 Potrero Ave
- 7347 Terrace Dr
- 1146 Richmond St
- 1150 Richmond St
- 1144 Richmond St
- 1142 Richmond St
- 1154 Richmond St
- 1156 Richmond St Unit 1156
- 1156 Richmond St
- 1140 Richmond St
- 1152 Richmond St
- 1158 Richmond St
- 1160 Richmond St
- 1162 Richmond St
- 1164 Richmond St
- 1126 Richmond St
- 1166 Richmond St
- 1132 Richmond St
- 1124 Richmond St
- 1134 Richmond St
- 1138 Richmond St
- 1136 Richmond St