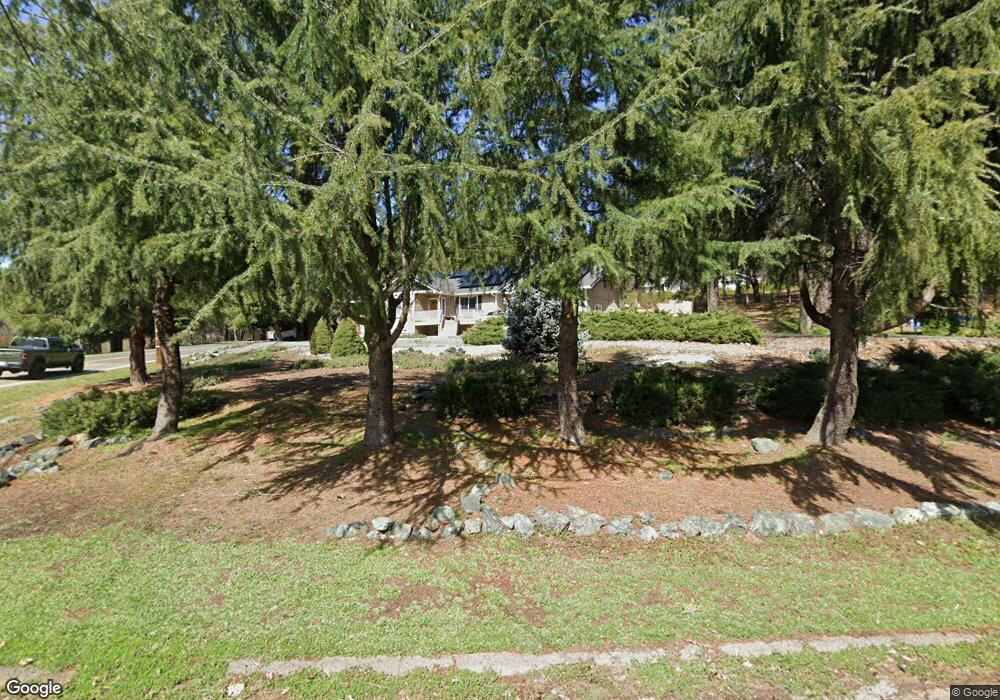
11486 Myrna Dr Grass Valley, CA 95945
Estimated Value: $513,000 - $567,000
3
Beds
2
Baths
1,846
Sq Ft
$290/Sq Ft
Est. Value
About This Home
This home is located at 11486 Myrna Dr, Grass Valley, CA 95945 and is currently estimated at $535,746, approximately $290 per square foot. 11486 Myrna Dr is a home located in Nevada County with nearby schools including Bell Hill Academy, Margaret G. Scotten Elementary School, and Lyman Gilmore Middle School.
Ownership History
Date
Name
Owned For
Owner Type
Purchase Details
Closed on
May 9, 2019
Sold by
The Starbuck Trust
Bought by
The Starbuck Trust
Current Estimated Value
Home Financials for this Owner
Home Financials are based on the most recent Mortgage that was taken out on this home.
Original Mortgage
$32,000
Outstanding Balance
$20,885
Interest Rate
4.2%
Mortgage Type
New Conventional
Estimated Equity
$514,862
Purchase Details
Closed on
Jul 9, 2005
Sold by
Smith Steven P and Smith Cindy L
Bought by
Belfield Jerry D and Belfield Deeann
Purchase Details
Closed on
Apr 12, 2004
Sold by
Katen Gloriann
Bought by
Smith Steven P and Smith Cindy L
Purchase Details
Closed on
Aug 8, 2002
Sold by
Putnam Jerry Scott and Putnam Susan
Bought by
Katen Gloriann
Home Financials for this Owner
Home Financials are based on the most recent Mortgage that was taken out on this home.
Original Mortgage
$164,400
Interest Rate
6.16%
Create a Home Valuation Report for This Property
The Home Valuation Report is an in-depth analysis detailing your home's value as well as a comparison with similar homes in the area
Home Values in the Area
Average Home Value in this Area
Purchase History
| Date | Buyer | Sale Price | Title Company |
|---|---|---|---|
| The Starbuck Trust | -- | First American Title Ins Co | |
| Belfield Jerry D | $459,000 | First American Title | |
| Smith Steven P | $120,000 | Fidelity National Title Co | |
| Katen Gloriann | $75,000 | Fidelity National Title Co |
Source: Public Records
Mortgage History
| Date | Status | Borrower | Loan Amount |
|---|---|---|---|
| Open | The Starbuck Trust | $32,000 | |
| Previous Owner | Katen Gloriann | $164,400 |
Source: Public Records
Tax History Compared to Growth
Tax History
| Year | Tax Paid | Tax Assessment Tax Assessment Total Assessment is a certain percentage of the fair market value that is determined by local assessors to be the total taxable value of land and additions on the property. | Land | Improvement |
|---|---|---|---|---|
| 2025 | $2,520 | $223,332 | $68,310 | $155,022 |
| 2024 | $2,454 | $218,954 | $66,971 | $151,983 |
| 2023 | $2,454 | $214,661 | $65,658 | $149,003 |
| 2022 | $2,427 | $210,453 | $64,371 | $146,082 |
| 2021 | $2,356 | $206,327 | $63,109 | $143,218 |
| 2020 | $2,350 | $204,212 | $62,462 | $141,750 |
| 2019 | $2,254 | $200,209 | $61,238 | $138,971 |
| 2018 | $0 | $196,285 | $60,038 | $136,247 |
| 2017 | $2,151 | $192,437 | $58,861 | $133,576 |
| 2016 | $2,074 | $188,664 | $57,707 | $130,957 |
| 2015 | $2,042 | $185,831 | $56,841 | $128,990 |
| 2014 | $2,042 | $182,192 | $55,728 | $126,464 |
Source: Public Records
Map
Nearby Homes
- 11675 Rogue House Place
- 14842 Pammy Way
- 11849 Rogue House Place
- 16481 Rattlesnake Rd
- 15214 Pammy Way
- 21607 Rambling Rd
- 11777 Hanley Dr
- 11332 Wilson Rd
- 12015 Alta Sierra Dr
- 15233 Sierra Star Ln
- 11419 Sunset Place
- 11860 Hanley Dr
- 12044 Francis Dr
- 11931 Alta Sierra Dr
- 11308 Ball Rd
- 11575 Bernadine Ct
- 15725 Carrie Dr
- 13705 Wheeler Acres Rd
- 12274 Kenneth Ct
- 14821 Hidden Rock Dr Unit 282