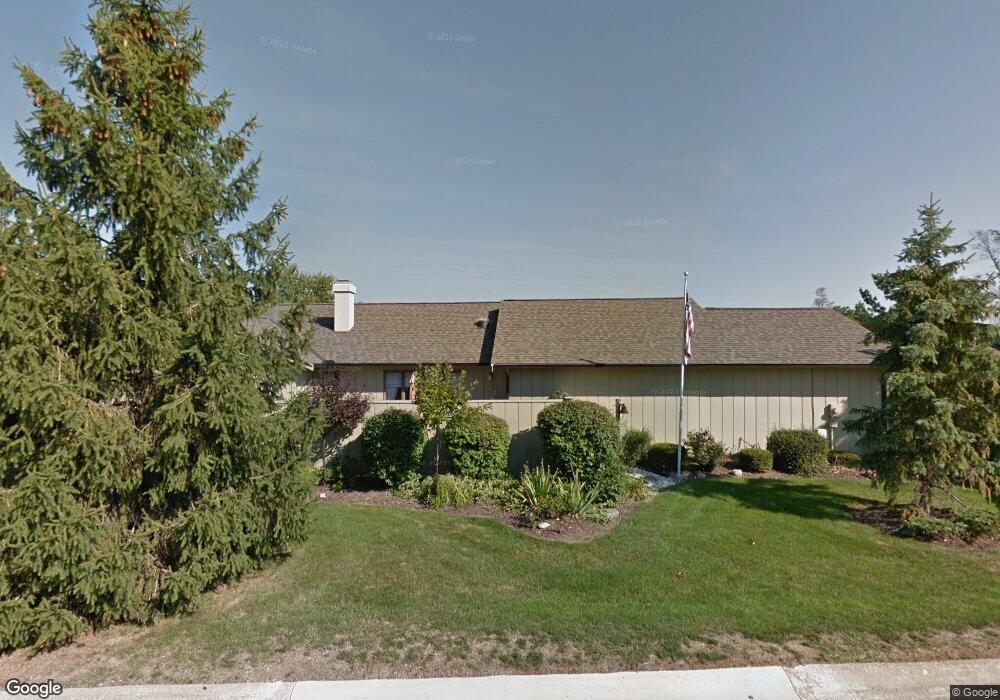
11494 Co Moor Blvd Strongsville, OH 44149
Estimated Value: $247,000 - $294,000
3
Beds
2
Baths
1,650
Sq Ft
$163/Sq Ft
Est. Value
About This Home
This home is located at 11494 Co Moor Blvd, Strongsville, OH 44149 and is currently estimated at $268,998, approximately $163 per square foot. 11494 Co Moor Blvd is a home located in Cuyahoga County with nearby schools including Strongsville High School and Sts Joseph & John Interparochial School.
Ownership History
Date
Name
Owned For
Owner Type
Purchase Details
Closed on
Nov 14, 2014
Sold by
Estate Of Clifford W Murphy
Bought by
Murphy Doris
Current Estimated Value
Purchase Details
Closed on
Aug 1, 2008
Sold by
Malleske Joseph F and Malleske Helen A
Bought by
Murphy Clifford W and Murphy Doris M
Home Financials for this Owner
Home Financials are based on the most recent Mortgage that was taken out on this home.
Original Mortgage
$45,000
Interest Rate
6.1%
Mortgage Type
Purchase Money Mortgage
Purchase Details
Closed on
Nov 10, 1993
Sold by
Malleske Joseph F
Bought by
Malleske, Joseph F - Trs
Purchase Details
Closed on
Dec 14, 1988
Sold by
Malleske Joseph
Bought by
Malleske Joseph F
Purchase Details
Closed on
Nov 16, 1987
Bought by
Malleske Joseph
Purchase Details
Closed on
Mar 27, 1987
Bought by
Fannin Bldrs. Inc
Purchase Details
Closed on
Jan 1, 1986
Bought by
Co-Moor Colony Sec 12 Inc
Create a Home Valuation Report for This Property
The Home Valuation Report is an in-depth analysis detailing your home's value as well as a comparison with similar homes in the area
Home Values in the Area
Average Home Value in this Area
Purchase History
| Date | Buyer | Sale Price | Title Company |
|---|---|---|---|
| Murphy Doris | -- | Attorney | |
| Murphy Clifford W | $159,900 | Real Living Title Agency Ltd | |
| Malleske, Joseph F - Trs | -- | -- | |
| Malleske Joseph F | -- | -- | |
| Malleske Joseph | $105,400 | -- | |
| Fannin Bldrs. Inc | -- | -- | |
| Co-Moor Colony Sec 12 Inc | -- | -- |
Source: Public Records
Mortgage History
| Date | Status | Borrower | Loan Amount |
|---|---|---|---|
| Previous Owner | Murphy Clifford W | $45,000 |
Source: Public Records
Tax History Compared to Growth
Tax History
| Year | Tax Paid | Tax Assessment Tax Assessment Total Assessment is a certain percentage of the fair market value that is determined by local assessors to be the total taxable value of land and additions on the property. | Land | Improvement |
|---|---|---|---|---|
| 2024 | $2,986 | $73,395 | $16,520 | $56,875 |
| 2023 | $3,084 | $58,420 | $15,650 | $42,770 |
| 2022 | $3,088 | $58,415 | $15,645 | $42,770 |
| 2021 | $3,063 | $58,420 | $15,650 | $42,770 |
| 2020 | $2,728 | $47,880 | $12,810 | $35,070 |
| 2019 | $2,648 | $136,800 | $36,600 | $100,200 |
| 2018 | $2,195 | $47,880 | $12,810 | $35,070 |
| 2017 | $2,025 | $39,270 | $9,730 | $29,540 |
| 2016 | $2,008 | $39,270 | $9,730 | $29,540 |
| 2015 | $2,091 | $39,270 | $9,730 | $29,540 |
| 2014 | $2,091 | $40,080 | $9,940 | $30,140 |
Source: Public Records
Map
Nearby Homes
- 11432 Pearl Rd
- 11499 Pearl Rd Unit A106
- 19240 Briarwood Ln
- 11179 Fawn Meadow Ln
- 10986 Fawn Meadow Ln
- 19997 Idlewood Trail
- 19890 Idlewood Trail
- 12385 Corinth Ct
- 12539 Olympus Way
- 20050 Idlewood Trail
- 18336 Falling Water Rd
- 12647 Edgepark Cir
- 12694 Ionia Ct
- 11650 River Moss Rd
- 13066 Olympus Way
- 13099 Olympus Way
- 18248 Meadow Ln
- 13156 Olympus Way
- 17945 Cliffside Dr
- 20424 Scotch Pine Way
- 11476 Co Moor Blvd
- 11458 Co Moor Blvd
- 11440 Co Moor Blvd
- 19259 Co Moor Blvd
- 19235 Co Moor Blvd
- 19301 Co Moor Blvd
- 11422 Co Moor Blvd
- 19247 Co Moor Blvd
- 11497 Co Moor Blvd
- 11479 Co Moor Blvd
- 11515 Co Moor Blvd
- 19211 Co Moor Blvd
- 11461 Co Moor Blvd
- 11533 Co Moor Blvd
- 19325 Co Moor Blvd
- 11443 Co Moor Blvd
- 19313 Co Moor Blvd
- 11425 Co Moor Blvd
- 19337 Co Moor Blvd
- 11386 Co Moor Blvd