NOT LISTED FOR SALE

115 Brandywynne Ln New Albany, IN 47150

Estimated Value: $399,000 - $491,000

3 Beds
2 Baths
2,624 Sq Ft
$165/Sq Ft Est. Value

Last Sold July 24, 2012

Last sale price $155,000 $59 Per Sq Ft

Est. 179% increase in value since last sale

Current estimated payment $2,456/month

54 Days on Market

Highlights

  • 0.6 Acre Lot
  • 2 Car Attached Garage
  • Forced Air Heating and Cooling System
  • 2 Fireplaces

About This Home

As of July 2012

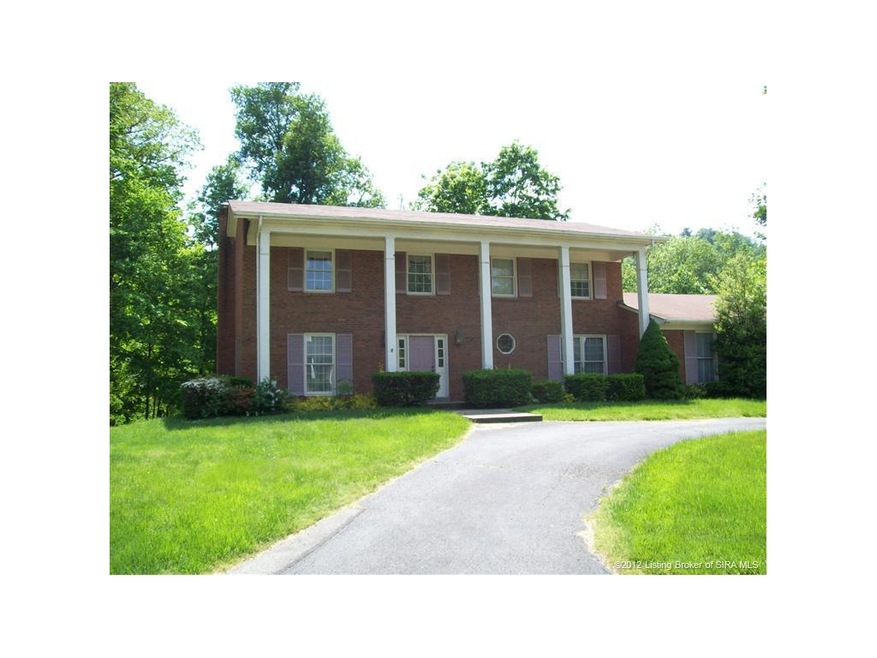
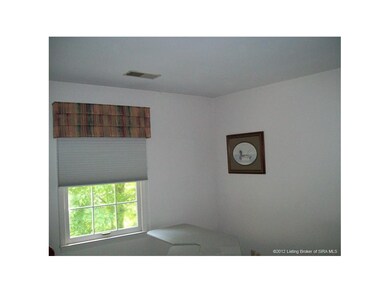
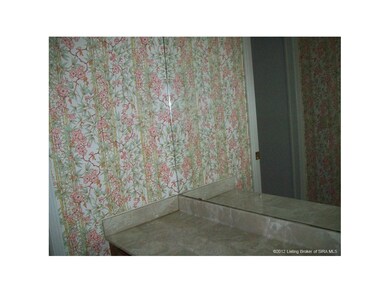
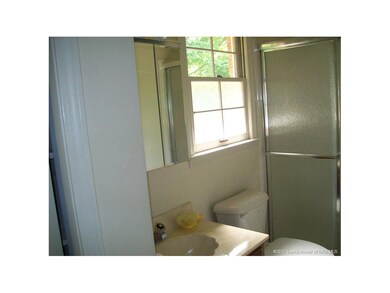
Great house in a great location needs TLC. Slate Foyer. Woodburning Fireplace in family room and in Master Bedroom. Chef's delight kitchen. Nice size rooms. Number of rooms, measurements and sq. ft. are not warranted. If critical buyer should verify.

Last Agent to Sell the Property

Patricia Harrison

RE/MAX FIRST License #RB14047603 Listed on: 05/04/2012

RE/MAX FIRST

Home Details

Home Type

  • Single Family

Est. Annual Taxes

  • $2,253

Year Built

  • Built in 1977

Lot Details

  • 0.6 Acre Lot

Parking

  • 2 Car Attached Garage

Home Design

  • Poured Concrete
  • Frame Construction

Interior Spaces

  • 2,624 Sq Ft Home
  • 2-Story Property
  • 2 Fireplaces
  • Basement Fills Entire Space Under The House

Bedrooms and Bathrooms

  • 3 Bedrooms
  • 2 Full Bathrooms

Utilities

  • Forced Air Heating and Cooling System
  • Electric Water Heater

Listing and Financial Details

  • Foreclosure
  • Assessor Parcel Number 220503300323000008

Home Details

Home Type

Single Family

Est. Annual Taxes

$2,253

Year Built

Built in 1977

Lot Details

0

Parking

2

Listing Details

  • Annual Tax: 2253
  • Appointment: Not Needed
  • Bank Owned Foreclosure YN: Yes
  • Construction: Frame On-Site
  • Deduction Type: Homestead Standard, Mortgage, Supplemental Homestd
  • Foundation: Poured Concrete
  • Legal Description: Plat 838 Lot 31 .60 A.
  • Lot Dimensions: 0 x 0
  • Numof Fireplaces: 2
  • Parcel Number: 220503300323000008
  • Property Sub Type: Residential
  • Property Type: Residential/Farm
  • Subdivision Yn: Yes
  • Total Finished Square Footage: 2624
  • Type: 2 Story
  • Year Built: 1977
  • Special Features: 20

Interior Features

  • Water Heater: Electric
  • Basement Type: Full
  • Above Grade Finished Sq Ft: 2624.00
  • Basement: Yes
  • Full Bathrooms: 2
  • Total Bathrooms: 2.00
  • Total Bedrooms: 3
  • Lot Measurement: Acres
  • Lot Sq Ft: 26136.00
  • Sewer Type: Sewer
  • Total Sq Ft: 2624

Garage/Parking

  • Garage Type: Attached
  • Garage Spaces: 2
  • Garage Yn: Yes

Utilities

  • Cooling Type: Central Air
  • Fuel Type: Electric
  • Heat Type: Forced Air
  • Water Type: Public Onsite

Lot Info

  • Acres: 0.6000
  • Zoning: Residential

Ownership History

Date Name Owned For Owner Type

Purchase Details

Listed on
May 4, 2012
Closed on
Jul 24, 2012
Sold by
First Harrison Bank
Bought by
Loppnow Brian H
Seller's Agent
Patricia Harrison
RE/MAX FIRST
List Price
$199,000
Sold Price
$155,000
Premium/Discount to List
-$44,000
-22.11%
Current Estimated Value
$432,031

Home Financials for this Owner

Home Financials are based on the most recent Mortgage that was taken out on this home.
Estimated Appreciation
$277,031
Avg. Annual Appreciation
7.96%
Original Mortgage
$124,000
Outstanding Balance
$85,838
Interest Rate
3.73%
Mortgage Type
New Conventional
Estimated Equity
$346,193
Source: Public Records

Range of Values:

--
Value Increase
--
Percent Increase
--
Adjusted for Inflation
Collateral Analytics

Collateral Analytics Collateral Analytics AVMs (Automated Valuation Model) employ a number of statistical approaches combined with neighborhood-specific comparable selection guarantees the most up-to-date and precise valuations.

Not Available

Collateral Analytics does not have data for the current month. Please view the chart for historical values.

ICE

ICE Mortgage Technology ICE Mortgage Technology’s AVM (Automated Valuation Model) is a state-of-the-art online residential property valuation tool that provides a quick and accurate estimate of the value of almost any home in the U.S.

Not Available

ICE Mortgage Technology does not have data for the current month. Please view the chart for historical values.

First American

First American First American Data & Analytics’ next-generation AVM combines unrivaled data assets with a blended ensemble of valuation models to produce highly accurate, reliable valuations you can trust.

Not Available

First American does not have data for the current month. Please view the chart for historical values.

Quantarium

Quantarium Quantarium’s valuation service, repeatedly proven the industry’s most accurate and comprehensive, is supercharged with a self-learning and auto-tuning AI engine that continually becomes smarter and more accurate as it processes daily inputs from the industry’s leading RE data lake.

Not Available

Quantarium does not have data for the current month. Please view the chart for historical values.

Average Value
Not Available
List Price
Sold Price
Create a Home Valuation Report for This Property
The Home Valuation Report is an in-depth analysis detailing your home's value as well as a comparison with similar homes in the area

Home Values in the Area

Source: Public Records

Average Home Value in this Area


Source: Public Records

Purchase History

Date Buyer Sale Price Title Company
Loppnow Brian H -- None Available
Source: Public Records

Mortgage History

Date Status Borrower Loan Amount
Open Loppnow Brian H $124,000
Source: Public Records

Property History

Date Event Price List to Sale Price per Sq Ft
07/24/2012 07/24/12 Sold $155,000 -22.1% $59 / Sq Ft
06/27/2012 06/27/12 Pending -- -- --
05/04/2012 05/04/12 For Sale $199,000 -- $76 / Sq Ft
Source: Southern Indiana REALTORS® Association

Tax History Compared to Growth

Source: Public Records

Tax History

Year Tax Paid Tax Assessment Tax Assessment Total Assessment is a certain percentage of the fair market value that is determined by local assessors to be the total taxable value of land and additions on the property. Land Improvement
2024 $2,275 $214,600 $37,100 $177,500
2023 $2,323 $218,600 $37,100 $181,500
2022 $2,414 $225,900 $37,100 $188,800
2021 $2,275 $211,500 $37,100 $174,400
2020 $2,279 $211,500 $37,100 $174,400
2019 $2,281 $211,500 $37,100 $174,400
2018 $2,752 $252,700 $37,100 $215,600
2017 $2,531 $228,800 $37,100 $191,700
2016 $2,267 $226,700 $37,100 $189,600
2014 $2,271 $227,100 $37,100 $190,000
2013 -- $220,900 $37,100 $183,800
Source: Public Records

Agents Affiliated with this Home

  • Section Image
See All Agents

Map

Source: Southern Indiana REALTORS® Association

MLS Number: 201203219

Southern Indiana REALTORS® Association

APN: 22-05-03-300-323.000-008