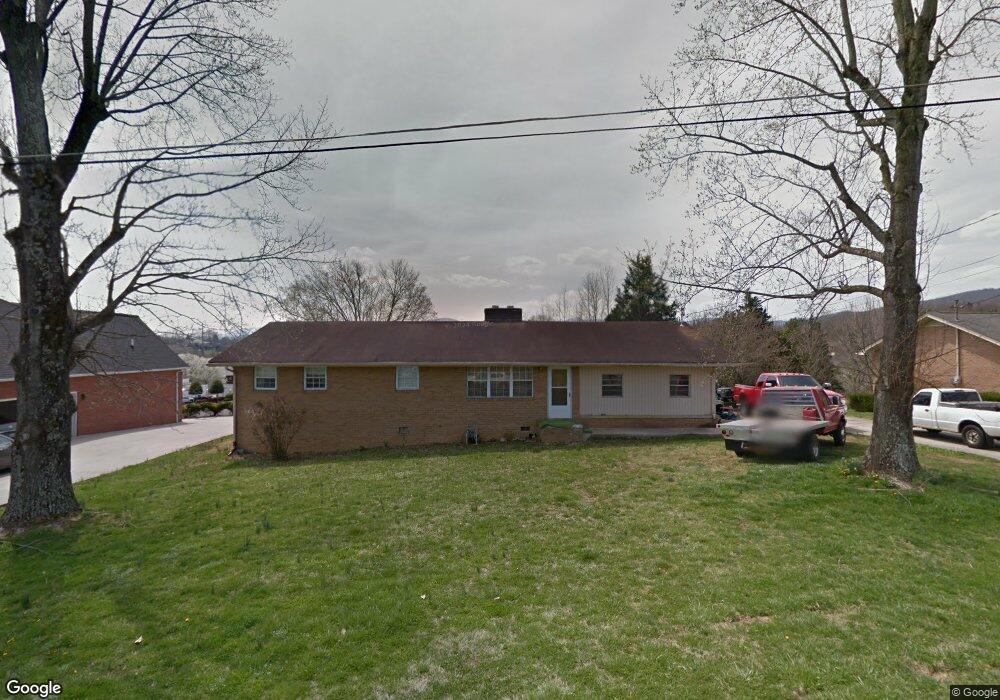
115 Colonial Heights La Follette, TN 37766
Estimated Value: $227,060 - $297,000
--
Bed
2
Baths
1,798
Sq Ft
$141/Sq Ft
Est. Value
About This Home
This home is located at 115 Colonial Heights, La Follette, TN 37766 and is currently estimated at $252,765, approximately $140 per square foot. 115 Colonial Heights is a home located in Campbell County with nearby schools including Calvary Christian Academy.
Ownership History
Date
Name
Owned For
Owner Type
Purchase Details
Closed on
Aug 28, 2007
Sold by
Saxon Mortgage Services
Bought by
Consumer Solutions Reo Llc
Current Estimated Value
Purchase Details
Closed on
Aug 23, 2007
Sold by
Consumer Solutions Reo Llc
Bought by
Rains William
Purchase Details
Closed on
Apr 18, 2007
Sold by
Whedbee Geoffrey
Bought by
Saxon Mortgage Services
Purchase Details
Closed on
Apr 12, 2007
Bought by
Saxton Mortgage Services Inc
Purchase Details
Closed on
Sep 7, 2005
Sold by
Whedbee Jana D
Bought by
Whedbee Geoffrey and Whedbee Jana D
Purchase Details
Closed on
Jan 28, 2004
Sold by
Whedbee Jana Denice
Bought by
Whedbee Jana D
Home Financials for this Owner
Home Financials are based on the most recent Mortgage that was taken out on this home.
Original Mortgage
$72,675
Interest Rate
5.77%
Purchase Details
Closed on
Oct 20, 2003
Bought by
Whedbee Jana Denice
Create a Home Valuation Report for This Property
The Home Valuation Report is an in-depth analysis detailing your home's value as well as a comparison with similar homes in the area
Home Values in the Area
Average Home Value in this Area
Purchase History
| Date | Buyer | Sale Price | Title Company |
|---|---|---|---|
| Consumer Solutions Reo Llc | -- | -- | |
| Rains William | $68,500 | -- | |
| Saxon Mortgage Services | $90,950 | -- | |
| Saxton Mortgage Services Inc | $91,000 | -- | |
| Whedbee Geoffrey | -- | -- | |
| Whedbee Jana D | -- | -- | |
| Whedbee Jana Denice | -- | -- |
Source: Public Records
Mortgage History
| Date | Status | Borrower | Loan Amount |
|---|---|---|---|
| Previous Owner | Whedbee Jana Denice | $72,675 |
Source: Public Records
Tax History Compared to Growth
Tax History
| Year | Tax Paid | Tax Assessment Tax Assessment Total Assessment is a certain percentage of the fair market value that is determined by local assessors to be the total taxable value of land and additions on the property. | Land | Improvement |
|---|---|---|---|---|
| 2025 | -- | $50,900 | $0 | $0 |
| 2024 | -- | $50,900 | $9,575 | $41,325 |
| 2023 | $905 | $26,925 | $6,125 | $20,800 |
| 2022 | $905 | $26,925 | $6,125 | $20,800 |
| 2021 | $905 | $26,925 | $6,125 | $20,800 |
| 2020 | $887 | $26,925 | $6,125 | $20,800 |
| 2019 | $905 | $26,925 | $6,125 | $20,800 |
| 2018 | $887 | $25,025 | $5,900 | $19,125 |
| 2017 | $887 | $25,025 | $5,900 | $19,125 |
| 2016 | $887 | $25,025 | $5,900 | $19,125 |
| 2015 | $822 | $25,025 | $5,900 | $19,125 |
| 2014 | -- | $25,025 | $5,900 | $19,125 |
| 2013 | -- | $25,025 | $5,900 | $19,125 |
Source: Public Records
Map
Nearby Homes
- 119 Colonial Heights
- 212 Ellison Rd
- 2527 Jacksboro Pike
- TBD Sweetgum Ln
- 0 Dogwood Ln
- 124 Chelsea Ln
- 109 Cherry Ln
- 205 Hickory Ln
- 799 Twin Hills Ln
- 264 Cypress Ln
- 165 Gamble Dr
- 1517 Towe String Rd
- 317 Indian Mound Cir
- 116 Michaela Ln
- 0 Eagle Bluff Rd
- 163 Mineral Springs Ln
- 320 Clover Cir
- 149 Island Ford Rd
- 496 Shawnee Dr
- 880 Hilltop Dr
- 0 Colonial Heights
- 116 Colonial Heights
- 123 Colonial Heights
- 114 Colonial Heights
- 200 Meadow Ln
- 126 Colonial Heights
- 204 Meadow Ln
- 119 Meadow Ln
- 131 Colonial Heights
- 128 Colonial Heights
- 203 Meadow Ln
- 210 Meadow Ln
- 181 Colonial Heights
- 107 Knoll Dr
- 209 Meadow Ln
- 134 Colonial Heights
- 139 Colonial Heights
- 214 Meadow Ln
- 110 Knoll Dr
- 213 Meadow Ln