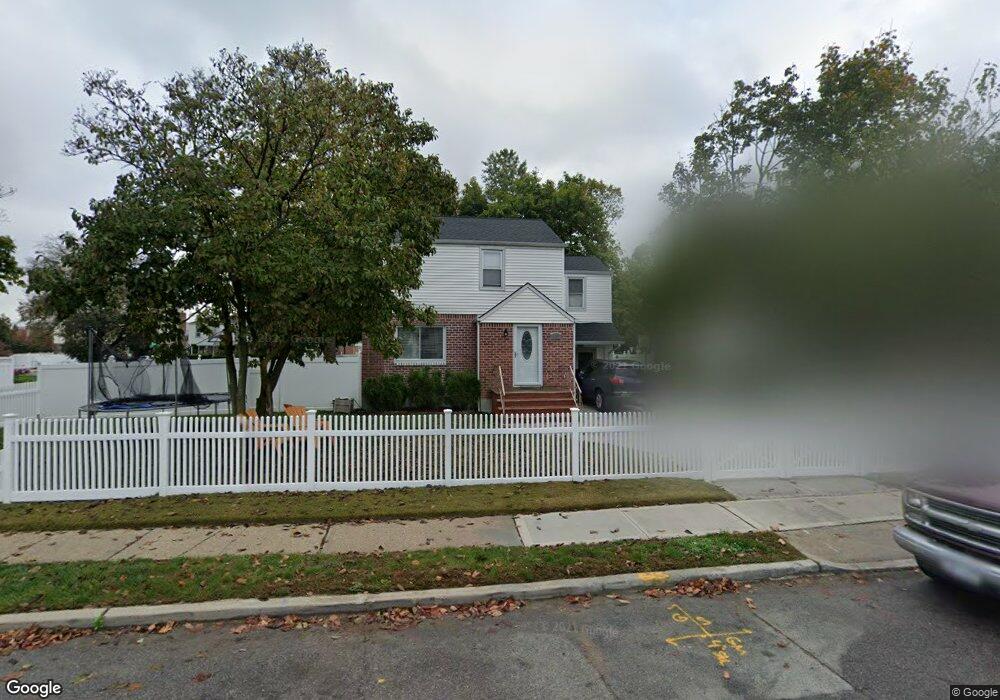
115 Flint Place Elmont, NY 11003
Estimated Value: $697,000 - $784,016
3
Beds
1
Bath
1,576
Sq Ft
$470/Sq Ft
Est. Value
About This Home
This home is located at 115 Flint Place, Elmont, NY 11003 and is currently estimated at $740,508, approximately $469 per square foot. 115 Flint Place is a home located in Nassau County with nearby schools including Cambria Center For The Gifted Child, Martin De Porres School, and Bible Baptist Academy.
Ownership History
Date
Name
Owned For
Owner Type
Purchase Details
Closed on
Oct 9, 2014
Sold by
Swift Carl
Bought by
Swift Edwouine
Current Estimated Value
Purchase Details
Closed on
Sep 19, 2008
Sold by
Us Bank National Association Series 2006
Bought by
Swift Carl A
Purchase Details
Closed on
Sep 4, 2007
Sold by
Deleonardis John C
Purchase Details
Closed on
Oct 17, 2005
Sold by
Barnes William
Bought by
Khan Akbal
Purchase Details
Closed on
Dec 4, 2003
Sold by
Tilson Ivy
Purchase Details
Closed on
Aug 5, 2002
Sold by
Moss Wilma
Purchase Details
Closed on
Mar 9, 2000
Sold by
Scanlon Diehl Eleanor
Bought by
Codrington Wilfred
Home Financials for this Owner
Home Financials are based on the most recent Mortgage that was taken out on this home.
Original Mortgage
$202,332
Interest Rate
8.31%
Mortgage Type
FHA
Create a Home Valuation Report for This Property
The Home Valuation Report is an in-depth analysis detailing your home's value as well as a comparison with similar homes in the area
Home Values in the Area
Average Home Value in this Area
Purchase History
| Date | Buyer | Sale Price | Title Company |
|---|---|---|---|
| Swift Edwouine | -- | None Available | |
| Swift Carl A | $300,000 | Stewart Title Insurance | |
| -- | $482,498 | -- | |
| Khan Akbal | $510,000 | -- | |
| -- | -- | -- | |
| -- | $260,000 | -- | |
| Codrington Wilfred | $204,000 | Nat Cerniglia |
Source: Public Records
Mortgage History
| Date | Status | Borrower | Loan Amount |
|---|---|---|---|
| Previous Owner | Codrington Wilfred | $202,332 |
Source: Public Records
Tax History Compared to Growth
Tax History
| Year | Tax Paid | Tax Assessment Tax Assessment Total Assessment is a certain percentage of the fair market value that is determined by local assessors to be the total taxable value of land and additions on the property. | Land | Improvement |
|---|---|---|---|---|
| 2025 | $13,291 | $514 | $267 | $247 |
| 2024 | $4,422 | $514 | $267 | $247 |
| 2023 | $13,214 | $514 | $267 | $247 |
| 2022 | $13,214 | $514 | $267 | $247 |
| 2021 | $18,248 | $491 | $255 | $236 |
| 2020 | $14,125 | $877 | $580 | $297 |
| 2019 | $14,574 | $877 | $580 | $297 |
| 2018 | $13,884 | $877 | $0 | $0 |
| 2017 | $8,441 | $877 | $580 | $297 |
| 2016 | $12,743 | $877 | $580 | $297 |
| 2015 | $3,997 | $877 | $580 | $297 |
| 2014 | $3,997 | $877 | $580 | $297 |
| 2013 | $3,747 | $877 | $580 | $297 |
Source: Public Records
Map
Nearby Homes
- 92 Norfeld Blvd
- 24 Garnet Place
- 114 Emily Ave
- 34 Diamond St
- 50 Crystal St
- 163 Emily Ave
- 1983 Dutch Broadway
- 86-A & B Gotham Ave
- 2018 Byron Ave
- 46 1st St
- 121 Barbara St
- 2093 Baylis Ave
- 1601 Johnson Ave Unit 23
- 2092 Hoffman Ave
- 11543 240th St
- 1747 Virginia Ave
- 220 Elzey Ave
- 222 Stone St
- 226 Franklin St
- 216 Elzey Ave