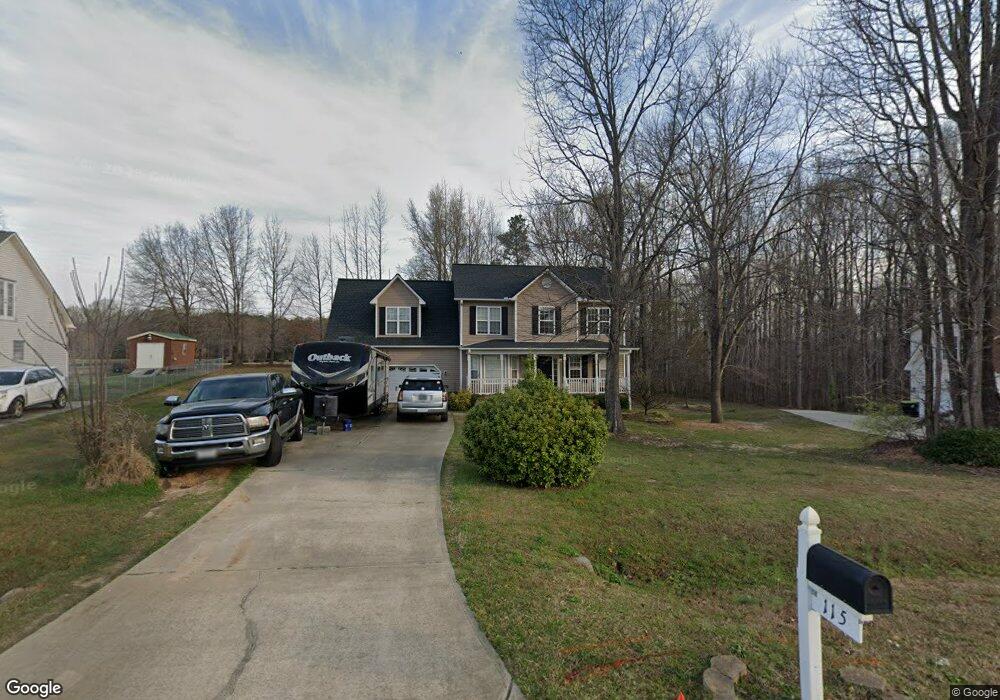
115 Hay Field Dr Clayton, NC 27520
Estimated Value: $387,000 - $390,000
3
Beds
3
Baths
2,349
Sq Ft
$165/Sq Ft
Est. Value
About This Home
This home is located at 115 Hay Field Dr, Clayton, NC 27520 and is currently estimated at $388,623, approximately $165 per square foot. 115 Hay Field Dr is a home located in Johnston County with nearby schools including Polenta Elementary School, Swift Creek Middle, and Cleveland High School.
Ownership History
Date
Name
Owned For
Owner Type
Purchase Details
Closed on
Mar 26, 2020
Sold by
Mupr 3 Assets Llc
Bought by
Cpi Amherst Program Owner Llc
Current Estimated Value
Purchase Details
Closed on
Oct 22, 2019
Sold by
Jardine Lawrence and Jardine Peggy A
Bought by
Mupr 3 Assets Llc
Purchase Details
Closed on
May 31, 2016
Sold by
Espada Laura L and Espada Henry
Bought by
Jardine Lawrence and Jardine Peggy A
Home Financials for this Owner
Home Financials are based on the most recent Mortgage that was taken out on this home.
Original Mortgage
$140,000
Interest Rate
3.58%
Mortgage Type
New Conventional
Purchase Details
Closed on
Mar 14, 2006
Sold by
Scott Lee Homes Inc
Bought by
Espada Henry and Espada Laura L
Home Financials for this Owner
Home Financials are based on the most recent Mortgage that was taken out on this home.
Original Mortgage
$143,920
Interest Rate
7.12%
Mortgage Type
Purchase Money Mortgage
Create a Home Valuation Report for This Property
The Home Valuation Report is an in-depth analysis detailing your home's value as well as a comparison with similar homes in the area
Home Values in the Area
Average Home Value in this Area
Purchase History
| Date | Buyer | Sale Price | Title Company |
|---|---|---|---|
| Cpi Amherst Program Owner Llc | $5,319,500 | None Available | |
| Mupr 3 Assets Llc | $245,000 | None Available | |
| Jardine Lawrence | $217,000 | None Available | |
| Espada Henry | $180,000 | None Available |
Source: Public Records
Mortgage History
| Date | Status | Borrower | Loan Amount |
|---|---|---|---|
| Previous Owner | Jardine Lawrence | $140,000 | |
| Previous Owner | Espada Henry | $143,920 |
Source: Public Records
Tax History Compared to Growth
Tax History
| Year | Tax Paid | Tax Assessment Tax Assessment Total Assessment is a certain percentage of the fair market value that is determined by local assessors to be the total taxable value of land and additions on the property. | Land | Improvement |
|---|---|---|---|---|
| 2025 | $2,436 | $383,550 | $80,000 | $303,550 |
| 2024 | $1,798 | $222,020 | $32,000 | $190,020 |
| 2023 | $1,710 | $222,020 | $32,000 | $190,020 |
| 2022 | $1,754 | $222,020 | $32,000 | $190,020 |
| 2021 | $1,754 | $222,020 | $32,000 | $190,020 |
| 2020 | $1,821 | $222,020 | $32,000 | $190,020 |
| 2019 | $1,821 | $222,020 | $32,000 | $190,020 |
| 2018 | $1,667 | $198,510 | $25,000 | $173,510 |
| 2017 | $1,667 | $198,510 | $25,000 | $173,510 |
| 2016 | $1,667 | $198,510 | $25,000 | $173,510 |
| 2015 | $1,667 | $198,510 | $25,000 | $173,510 |
| 2014 | $1,667 | $198,510 | $25,000 | $173,510 |
Source: Public Records
Map
Nearby Homes
- 75 Santa Gertrudis Dr
- 2005 Mooregate Ct
- 60 Branding Iron Dr
- 196 Cozy Brook Ct
- 210 Clearwater Ct
- 76 Cozy Brook Ct
- 109 Fountain Dr
- 346 Silver Creek Dr
- 254 Dungannon Loop
- 507 Dungannon Loop
- 15 Saddle Mare St
- 31 Saddle Mare St
- 45 Saddle Mare St
- 57 Saddle Mare St
- 71 Saddle Mare St
- 87 Saddle Mare St
- 118 Saddle Mare St
- 132 Saddle Mare St
- 445 Swift Creek Farm Ln
- 229 Deep Creek Dr
- 101 Hay Field Dr
- 135 Hay Field Dr
- 135 Hay Field Dr Unit 42
- 85 Hay Field Dr
- 147 Hay Field Dr
- 550 Jack Rd
- 112 Hay Field Dr
- 138 Hay Field Dr
- 78 Hay Field Dr
- 163 Hay Field Dr
- 57 Hay Field Dr
- 172 Hay Field Dr
- 78 Locomotive Way
- 71 Locomotive Way
- 45 Locomotive Way
- 31 Locomotive Way
- 15 Locomotive Way
- 53 Locomotive Way
- 171 Hay Field Dr
- 50 Hay Field Dr