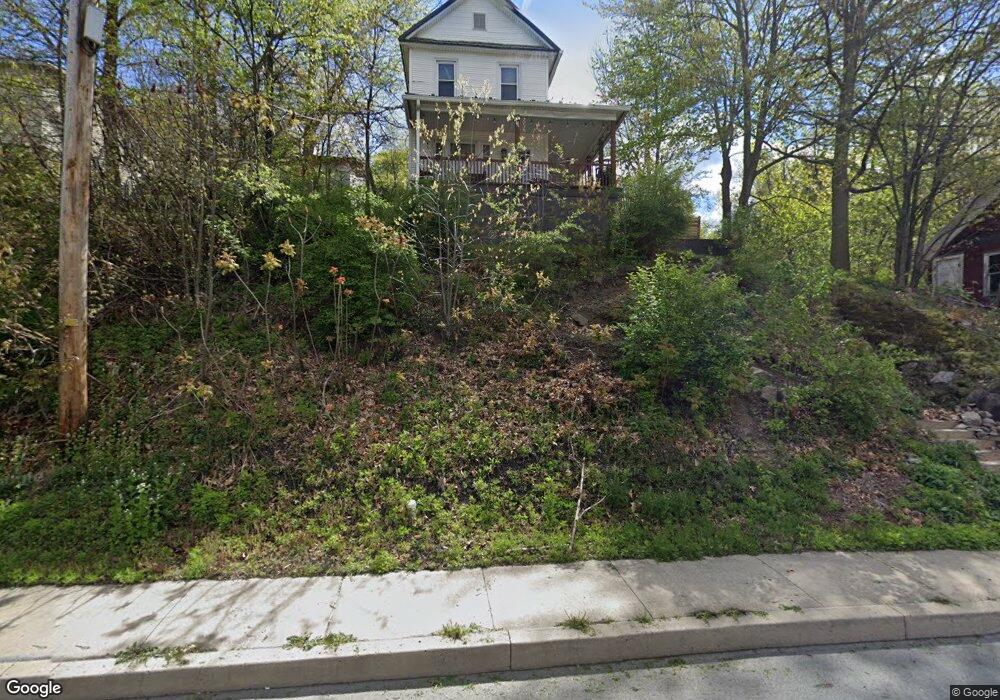
115 Main St Dupont, PA 18641
Estimated Value: $149,000 - $222,000
3
Beds
2
Baths
1,415
Sq Ft
$123/Sq Ft
Est. Value
About This Home
This home is located at 115 Main St, Dupont, PA 18641 and is currently estimated at $174,500, approximately $123 per square foot. 115 Main St is a home located in Luzerne County with nearby schools including Pittston City Intermediate Center, Pittston Area Middle School, and Frederick County Middle School.
Ownership History
Date
Name
Owned For
Owner Type
Purchase Details
Closed on
Jul 26, 2016
Sold by
Vanness Jonathan
Bought by
Fenner Randolph Scott and Ward Fenner Robert
Current Estimated Value
Home Financials for this Owner
Home Financials are based on the most recent Mortgage that was taken out on this home.
Original Mortgage
$103,550
Outstanding Balance
$82,834
Interest Rate
3.56%
Mortgage Type
New Conventional
Estimated Equity
$91,666
Purchase Details
Closed on
Nov 5, 2014
Sold by
Secretary Of Housing & Urban Development
Bought by
Vanness Jonathan
Purchase Details
Closed on
Oct 23, 2013
Sold by
Leach Diana and Leach Katrina
Bought by
The Secretary Of Housing & Urban Develop
Purchase Details
Closed on
Aug 4, 2005
Sold by
Tax Claim Bureau
Bought by
Pilger James
Create a Home Valuation Report for This Property
The Home Valuation Report is an in-depth analysis detailing your home's value as well as a comparison with similar homes in the area
Home Values in the Area
Average Home Value in this Area
Purchase History
| Date | Buyer | Sale Price | Title Company |
|---|---|---|---|
| Fenner Randolph Scott | $109,000 | None Available | |
| Vanness Jonathan | $18,000 | None Available | |
| The Secretary Of Housing & Urban Develop | $82,976 | None Available | |
| Pilger James | $15,000 | None Available |
Source: Public Records
Mortgage History
| Date | Status | Borrower | Loan Amount |
|---|---|---|---|
| Open | Fenner Randolph Scott | $103,550 |
Source: Public Records
Tax History Compared to Growth
Tax History
| Year | Tax Paid | Tax Assessment Tax Assessment Total Assessment is a certain percentage of the fair market value that is determined by local assessors to be the total taxable value of land and additions on the property. | Land | Improvement |
|---|---|---|---|---|
| 2025 | $1,544 | $62,700 | $18,800 | $43,900 |
| 2024 | $1,544 | $62,700 | $18,800 | $43,900 |
| 2023 | $1,544 | $62,700 | $18,800 | $43,900 |
| 2022 | $1,532 | $62,700 | $18,800 | $43,900 |
| 2021 | $1,532 | $62,700 | $18,800 | $43,900 |
| 2020 | $1,497 | $62,700 | $18,800 | $43,900 |
| 2019 | $1,485 | $62,700 | $18,800 | $43,900 |
| 2018 | $1,454 | $62,700 | $18,800 | $43,900 |
| 2017 | $1,390 | $62,700 | $18,800 | $43,900 |
| 2016 | -- | $62,700 | $18,800 | $43,900 |
| 2015 | -- | $62,700 | $18,800 | $43,900 |
| 2014 | -- | $62,700 | $18,800 | $43,900 |
Source: Public Records
Map
Nearby Homes