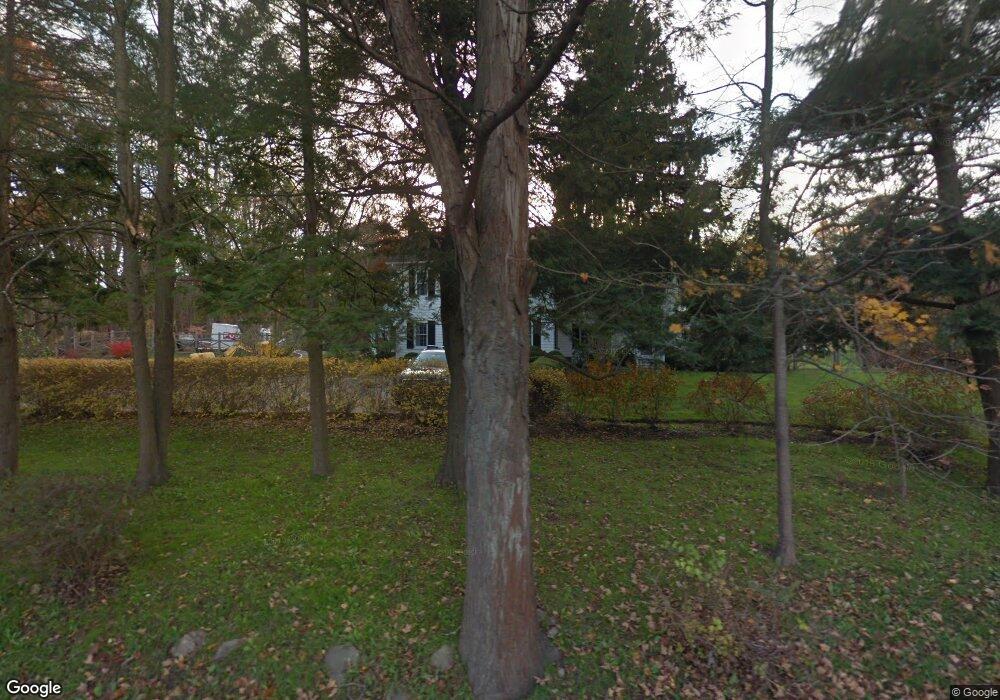
115 Pine Brook Rd Bedford, NY 10506
Estimated Value: $2,518,000 - $2,650,000
--
Bed
--
Bath
--
Sq Ft
4.97
Acres
About This Home
This home is located at 115 Pine Brook Rd, Bedford, NY 10506 and is currently estimated at $2,591,740. 115 Pine Brook Rd is a home located in Westchester County with nearby schools including Bedford Village Elementary School, Fox Lane Middle School, and Fox Lane High School.
Ownership History
Date
Name
Owned For
Owner Type
Purchase Details
Closed on
May 1, 2007
Sold by
Swank Mark E and Swank Cynthia W
Bought by
Rogers David Edward and Dexter Elizabeth Richards
Current Estimated Value
Home Financials for this Owner
Home Financials are based on the most recent Mortgage that was taken out on this home.
Original Mortgage
$1,893,750
Outstanding Balance
$1,118,873
Interest Rate
5.65%
Mortgage Type
Purchase Money Mortgage
Estimated Equity
$1,472,867
Purchase Details
Closed on
Nov 5, 2004
Sold by
Vanwinkle Cornelia Mcl and Van Winkle Edgar B
Bought by
Swank Mark F and Swank Cynthia W
Home Financials for this Owner
Home Financials are based on the most recent Mortgage that was taken out on this home.
Original Mortgage
$925,000
Interest Rate
5.8%
Mortgage Type
Purchase Money Mortgage
Purchase Details
Closed on
Oct 17, 2003
Sold by
Vanwinkle Cornelia Mcl
Bought by
Vanwinkle Cornelia Mcl and Vanwinkle Edgar B
Purchase Details
Closed on
Aug 29, 2003
Sold by
Vanwinkle Cornelia Mcl and Vanwinkle Edgar B
Bought by
Vanwinkle Cornelia
Purchase Details
Closed on
Jun 14, 2000
Sold by
Vanwinkle Cornelia Mcl
Bought by
Vanwinkle Cornelia Mcl and Vanwinkle Edgar B
Create a Home Valuation Report for This Property
The Home Valuation Report is an in-depth analysis detailing your home's value as well as a comparison with similar homes in the area
Home Values in the Area
Average Home Value in this Area
Purchase History
| Date | Buyer | Sale Price | Title Company |
|---|---|---|---|
| Rogers David Edward | $2,525,000 | Chicago Title Insurance Co | |
| Swank Mark F | $1,425,000 | -- | |
| Vanwinkle Cornelia Mcl | -- | -- | |
| Vanwinkle Cornelia | -- | Chicago Title Insurance Co | |
| Vanwinkle Cornelia Mcl | -- | First American Title Ins Co |
Source: Public Records
Mortgage History
| Date | Status | Borrower | Loan Amount |
|---|---|---|---|
| Open | Rogers David Edward | $1,893,750 | |
| Previous Owner | Swank Mark F | $925,000 |
Source: Public Records
Tax History Compared to Growth
Tax History
| Year | Tax Paid | Tax Assessment Tax Assessment Total Assessment is a certain percentage of the fair market value that is determined by local assessors to be the total taxable value of land and additions on the property. | Land | Improvement |
|---|---|---|---|---|
| 2024 | $51,622 | $210,845 | $36,800 | $174,045 |
| 2023 | $50,717 | $210,845 | $36,800 | $174,045 |
| 2022 | $48,022 | $210,845 | $36,800 | $174,045 |
| 2021 | $48,088 | $210,845 | $36,800 | $174,045 |
| 2020 | $45,588 | $210,845 | $36,800 | $174,045 |
| 2019 | $41,374 | $210,845 | $36,800 | $174,045 |
| 2018 | $34,136 | $157,500 | $36,800 | $120,700 |
| 2017 | $20,401 | $157,500 | $36,800 | $120,700 |
| 2016 | $31,753 | $157,500 | $36,800 | $120,700 |
| 2015 | -- | $138,600 | $36,800 | $101,800 |
| 2014 | -- | $138,600 | $36,800 | $101,800 |
| 2013 | -- | $138,600 | $36,800 | $101,800 |
Source: Public Records
Map
Nearby Homes
- 9 Old Corner Rd
- 28 Heron Lake Rd
- 1 Pine Brook Rd
- 383 Pine Brook Rd
- 56 Brook Farm Ln
- 51 Major Lockwood Ln
- 65 Hickory Ln
- 23 Tatomuck Rd
- 17 Great Hill Farms Rd
- 201 Long Ridge Rd
- 0 Brook Farm Rd E
- 199 Upper Shad Rd
- 24 Twin Fawn Ln
- 16 Col Sheldon Ln
- 16 Millers Mill Rd
- 25 Col Sheldon Ln
- 32 Joshua Hobby Ln
- 22 Joshua Hobby Ln
- 147 Mianus River Rd
- 440 Long Ridge Rd
- 100 Pine Brook Rd
- 21 Bishop Rd
- 134 Pine Brook Rd
- 20 Upland Rd S
- 91 Pine Brook Rd
- 16 Bishop Rd
- 105 Old Corner Rd
- 145 Pine Brook Rd
- 145 Pine Brook Rd Unit a
- 96 Pine Brook Rd
- 37 Bishop Rd
- 91 Old Corner Rd
- 67 Pine Brook Rd
- 100 Old Corner Rd
- 36 Bishop Rd
- 76 Pine Brook Rd
- 162 Pine Brook Rd
- 77 Old Corner Rd
- 40 Upland Rd S
- 90 Pine Brook Rd