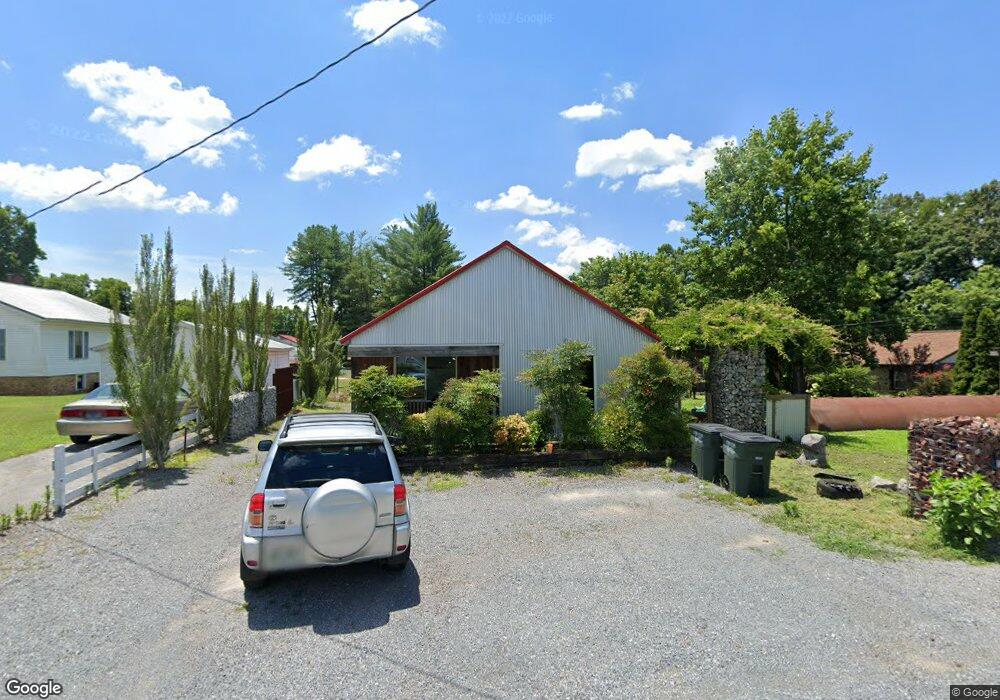
115 W Bronson St Sparta, TN 38583
Estimated Value: $158,000 - $180,000
--
Bed
1
Bath
884
Sq Ft
$193/Sq Ft
Est. Value
About This Home
This home is located at 115 W Bronson St, Sparta, TN 38583 and is currently estimated at $170,320, approximately $192 per square foot. 115 W Bronson St is a home located in White County with nearby schools including Woodland Park Elementary School, White County Middle School, and White County High School.
Ownership History
Date
Name
Owned For
Owner Type
Purchase Details
Closed on
Jun 21, 2024
Sold by
Brown Shelby
Bought by
England Trent W
Current Estimated Value
Home Financials for this Owner
Home Financials are based on the most recent Mortgage that was taken out on this home.
Original Mortgage
$8,350
Outstanding Balance
$8,245
Interest Rate
7.09%
Estimated Equity
$162,075
Purchase Details
Closed on
Jun 18, 2021
Sold by
Austin Donald E
Bought by
Brown Shelby D
Home Financials for this Owner
Home Financials are based on the most recent Mortgage that was taken out on this home.
Original Mortgage
$114,500
Interest Rate
2.9%
Mortgage Type
Purchase Money Mortgage
Purchase Details
Closed on
Nov 12, 2004
Sold by
Goff Summers Agnes
Bought by
Eugene Austin Donald
Purchase Details
Closed on
May 3, 1984
Bought by
Goff Agnes and Goff Summers L
Purchase Details
Closed on
Jan 1, 1979
Create a Home Valuation Report for This Property
The Home Valuation Report is an in-depth analysis detailing your home's value as well as a comparison with similar homes in the area
Home Values in the Area
Average Home Value in this Area
Purchase History
| Date | Buyer | Sale Price | Title Company |
|---|---|---|---|
| England Trent W | $167,000 | Encore Title & Closing | |
| Brown Shelby D | $135,000 | None Available | |
| Eugene Austin Donald | $28,000 | -- | |
| Goff Agnes | -- | -- | |
| -- | $11,700 | -- |
Source: Public Records
Mortgage History
| Date | Status | Borrower | Loan Amount |
|---|---|---|---|
| Open | England Trent W | $8,350 | |
| Open | England Trent W | $163,975 | |
| Previous Owner | Brown Shelby D | $114,500 |
Source: Public Records
Tax History Compared to Growth
Tax History
| Year | Tax Paid | Tax Assessment Tax Assessment Total Assessment is a certain percentage of the fair market value that is determined by local assessors to be the total taxable value of land and additions on the property. | Land | Improvement |
|---|---|---|---|---|
| 2024 | -- | $16,200 | $2,500 | $13,700 |
| 2023 | $481 | $16,200 | $2,500 | $13,700 |
| 2022 | $481 | $16,200 | $2,500 | $13,700 |
| 2021 | $371 | $16,200 | $2,500 | $13,700 |
| 2020 | $371 | $12,500 | $2,500 | $10,000 |
| 2019 | $363 | $11,700 | $2,000 | $9,700 |
| 2018 | $290 | $9,350 | $2,000 | $7,350 |
| 2017 | $290 | $9,350 | $2,000 | $7,350 |
| 2016 | $290 | $9,350 | $2,000 | $7,350 |
| 2015 | $271 | $9,350 | $2,000 | $7,350 |
| 2014 | -- | $6,725 | $2,000 | $4,725 |
| 2013 | -- | $5,425 | $1,250 | $4,175 |
Source: Public Records
Map
Nearby Homes
- 132 W Bronson St
- 112 N Church St
- 105 N Church St
- 107 N Main St
- 18 N Church St
- 244 W Bockman Way
- 00 Jenna Passons Ln
- 119 Walker St
- 560 Harley's Ridge
- 00 Deer View Dr
- 612 Harleys Ridge
- Lot 3&4 Harbor Green Place
- 0 N Main St
- 331 W Everett St
- Lot 3 & 4 Harbor Green Place
- 0 E Bockman Way
- 0 Knowles St
- 113 N Spring St
- 316 Gaines St
- 00 E Bockman Way
- 121 Saylors St
- 117 Saylors St
- 113 Scott Ln
- 119 W Bronson St
- 116 W Bronson St
- 115 Saylors St
- 118 W Bronson St
- 123 W Bronson St
- 109 Scott Ln
- 111 Saylors St
- 120 W Bronson St
- 120 Saylors St
- 115 Scott Ln
- 109 Saylors St
- 125 W Bronson St
- 116 Saylors St
- 100 W Bronson St
- 107 Saylors St
- 114 Saylors St
- 110 Saylors St