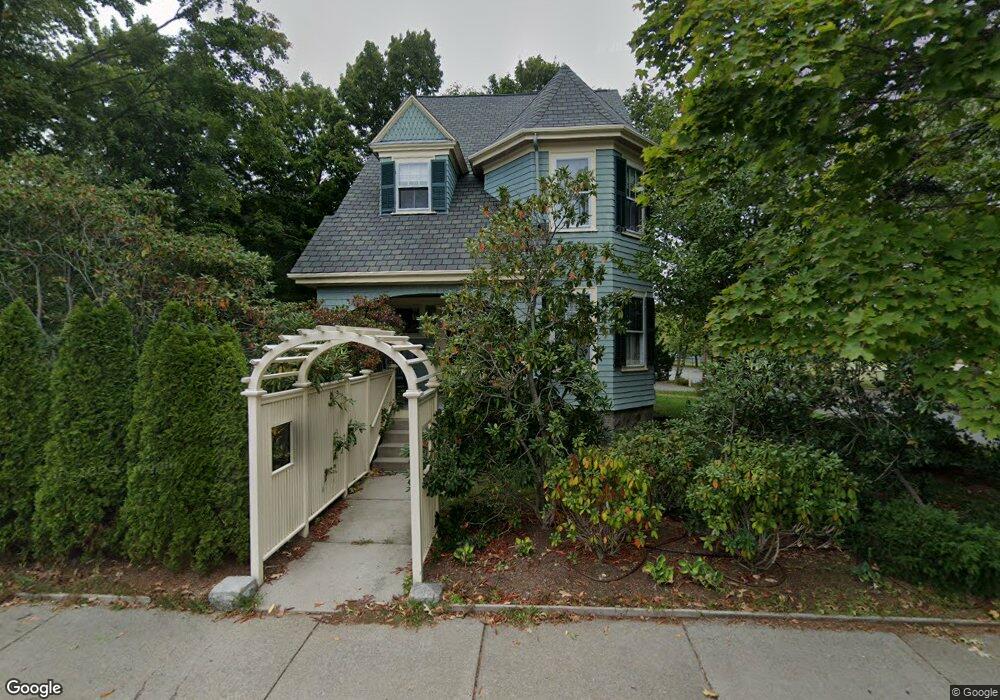
115 Webster St West Newton, MA 02465
West Newton NeighborhoodEstimated Value: $1,255,000 - $1,545,000
4
Beds
3
Baths
2,375
Sq Ft
$604/Sq Ft
Est. Value
About This Home
This home is located at 115 Webster St, West Newton, MA 02465 and is currently estimated at $1,433,484, approximately $603 per square foot. 115 Webster St is a home located in Middlesex County with nearby schools including C.C. Burr, F.A. Day Middle School, and Newton North High School.
Ownership History
Date
Name
Owned For
Owner Type
Purchase Details
Closed on
Oct 21, 1987
Sold by
Moriarty Brian J
Bought by
Mackenzie Malcolm R
Current Estimated Value
Home Financials for this Owner
Home Financials are based on the most recent Mortgage that was taken out on this home.
Original Mortgage
$212,000
Interest Rate
10.92%
Mortgage Type
Purchase Money Mortgage
Create a Home Valuation Report for This Property
The Home Valuation Report is an in-depth analysis detailing your home's value as well as a comparison with similar homes in the area
Home Values in the Area
Average Home Value in this Area
Purchase History
| Date | Buyer | Sale Price | Title Company |
|---|---|---|---|
| Mackenzie Malcolm R | $265,000 | -- |
Source: Public Records
Mortgage History
| Date | Status | Borrower | Loan Amount |
|---|---|---|---|
| Closed | Mackenzie Malcolm R | $168,800 | |
| Closed | Mackenzie Malcolm R | $212,000 |
Source: Public Records
Tax History Compared to Growth
Tax History
| Year | Tax Paid | Tax Assessment Tax Assessment Total Assessment is a certain percentage of the fair market value that is determined by local assessors to be the total taxable value of land and additions on the property. | Land | Improvement |
|---|---|---|---|---|
| 2025 | $11,519 | $1,175,400 | $801,800 | $373,600 |
| 2024 | $11,138 | $1,141,200 | $778,400 | $362,800 |
| 2023 | $10,531 | $1,034,500 | $598,600 | $435,900 |
| 2022 | $10,077 | $957,900 | $554,300 | $403,600 |
| 2021 | $9,724 | $903,700 | $522,900 | $380,800 |
| 2020 | $9,435 | $903,700 | $522,900 | $380,800 |
| 2019 | $9,169 | $877,400 | $507,700 | $369,700 |
| 2018 | $8,789 | $812,300 | $458,800 | $353,500 |
| 2017 | $8,521 | $766,300 | $432,800 | $333,500 |
| 2016 | $8,150 | $716,200 | $404,500 | $311,700 |
| 2015 | $7,771 | $669,300 | $378,000 | $291,300 |
Source: Public Records
Map
Nearby Homes
- 371 Cherry St
- 2 Elm St Unit 6
- 2 Elm St Unit 8
- 106 River St Unit 18
- 106 River St Unit 2
- 106 River St Unit 14
- 14 Cottage Place Unit 14
- 10 Crescent St Unit 1
- 10 Crescent St Unit 2
- 90 Auburndale Ave
- 17 Crescent St
- 0 Duncan Rd Unit 72925240
- 44 Westland Ave
- 287 Cherry St Unit 2
- 41 Kilburn Rd
- 56 Dearborn St
- 51 Bourne St
- 17 Gilbert St
- 160 Pine St Unit 12
- 13 Weir St
- 83 Oak Ave Unit 1
- 83 Oak Ave
- 125 Webster St
- 125 Webster St Unit 1
- 125 Webster St Unit B
- 125 Webster St Unit A
- 125 Webster St Unit 1-A
- 112 Webster St Unit 112
- 112 Webster St
- 16 Webster Place
- 79 Oak Ave
- 110 Webster St Unit 112
- 120 Webster St
- 75 Oak Ave Unit 2
- 114 Webster St Unit 114
- 126 Webster St Unit 128
- 73 Oak Ave Unit 1
- 73 Oak Ave Unit 75
- 73 Oak Ave Unit 75
- 73 Oak Ave