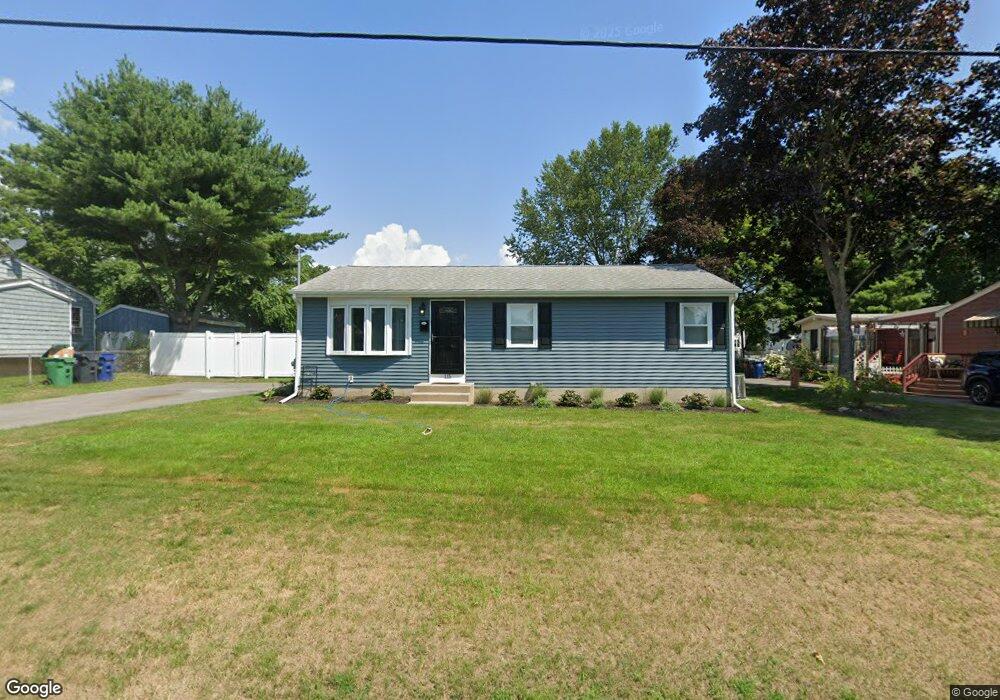
115 Wilson Ave Warwick, RI 02889
Oakland Beach NeighborhoodEstimated Value: $329,000 - $348,000
3
Beds
1
Bath
960
Sq Ft
$353/Sq Ft
Est. Value
About This Home
This home is located at 115 Wilson Ave, Warwick, RI 02889 and is currently estimated at $338,428, approximately $352 per square foot. 115 Wilson Ave is a home located in Kent County with nearby schools including Saint Kevin School and Bishop Hendricken High School.
Ownership History
Date
Name
Owned For
Owner Type
Purchase Details
Closed on
Jul 15, 2024
Sold by
Nickerson Cheryl A
Bought by
Bica Brennan and Lemieux Jessica
Current Estimated Value
Home Financials for this Owner
Home Financials are based on the most recent Mortgage that was taken out on this home.
Original Mortgage
$262,400
Outstanding Balance
$259,058
Interest Rate
7.03%
Mortgage Type
Purchase Money Mortgage
Estimated Equity
$79,370
Purchase Details
Closed on
Jul 31, 1998
Sold by
Bank New York Trustee
Bought by
Nickerson Cheryl A
Home Financials for this Owner
Home Financials are based on the most recent Mortgage that was taken out on this home.
Original Mortgage
$74,961
Interest Rate
6.92%
Mortgage Type
Purchase Money Mortgage
Create a Home Valuation Report for This Property
The Home Valuation Report is an in-depth analysis detailing your home's value as well as a comparison with similar homes in the area
Home Values in the Area
Average Home Value in this Area
Purchase History
| Date | Buyer | Sale Price | Title Company |
|---|---|---|---|
| Bica Brennan | $328,000 | None Available | |
| Bica Brennan | $328,000 | None Available | |
| Nickerson Cheryl A | $75,000 | -- | |
| Nickerson Cheryl A | $75,000 | -- |
Source: Public Records
Mortgage History
| Date | Status | Borrower | Loan Amount |
|---|---|---|---|
| Open | Bica Brennan | $262,400 | |
| Closed | Bica Brennan | $262,400 | |
| Previous Owner | Nickerson Cheryl A | $91,500 | |
| Previous Owner | Nickerson Cheryl A | $74,961 |
Source: Public Records
Tax History Compared to Growth
Tax History
| Year | Tax Paid | Tax Assessment Tax Assessment Total Assessment is a certain percentage of the fair market value that is determined by local assessors to be the total taxable value of land and additions on the property. | Land | Improvement |
|---|---|---|---|---|
| 2025 | $4,086 | $321,700 | $105,800 | $215,900 |
| 2024 | $3,892 | $269,000 | $87,400 | $181,600 |
| 2023 | $3,817 | $269,000 | $87,400 | $181,600 |
| 2022 | $3,476 | $185,600 | $49,500 | $136,100 |
| 2021 | $3,476 | $185,600 | $49,500 | $136,100 |
| 2020 | $3,476 | $185,600 | $49,500 | $136,100 |
| 2019 | $3,476 | $185,600 | $49,500 | $136,100 |
| 2018 | $2,885 | $138,700 | $49,500 | $89,200 |
| 2017 | $2,807 | $138,700 | $49,500 | $89,200 |
| 2016 | $2,807 | $138,700 | $49,500 | $89,200 |
| 2015 | $2,955 | $142,400 | $64,900 | $77,500 |
| 2014 | $2,857 | $142,400 | $64,900 | $77,500 |
| 2013 | $2,818 | $142,400 | $64,900 | $77,500 |
Source: Public Records
Map
Nearby Homes