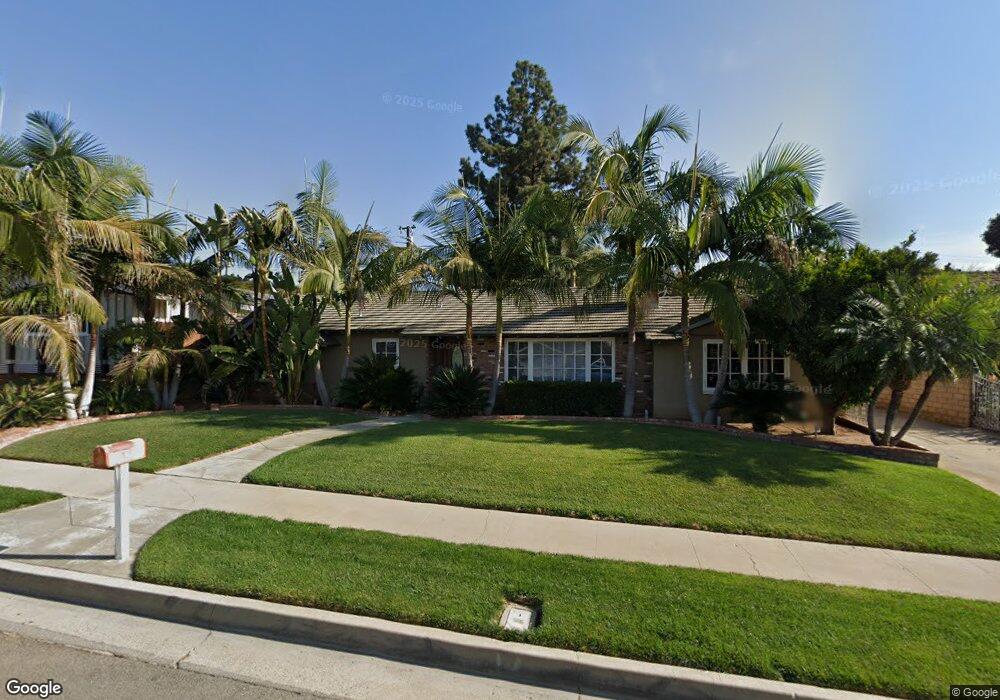
1150 Cheri Dr La Habra, CA 90631
Estimated Value: $1,022,353 - $1,157,000
3
Beds
2
Baths
2,023
Sq Ft
$536/Sq Ft
Est. Value
About This Home
This home is located at 1150 Cheri Dr, La Habra, CA 90631 and is currently estimated at $1,084,338, approximately $536 per square foot. 1150 Cheri Dr is a home located in Orange County with nearby schools including El Portal Elementary School, Rancho-Starbuck Intermediate School, and La Habra High School.
Ownership History
Date
Name
Owned For
Owner Type
Purchase Details
Closed on
Mar 20, 2019
Sold by
Mellick William H
Bought by
William Mellick Trust
Current Estimated Value
Purchase Details
Closed on
Jul 13, 2009
Sold by
Mellick William H
Bought by
Mellick William H
Home Financials for this Owner
Home Financials are based on the most recent Mortgage that was taken out on this home.
Original Mortgage
$360,000
Outstanding Balance
$238,279
Interest Rate
5.59%
Mortgage Type
New Conventional
Estimated Equity
$846,059
Purchase Details
Closed on
Jul 7, 1998
Sold by
Elizabeth Mellick
Bought by
Mellick William H
Home Financials for this Owner
Home Financials are based on the most recent Mortgage that was taken out on this home.
Original Mortgage
$210,400
Interest Rate
7%
Create a Home Valuation Report for This Property
The Home Valuation Report is an in-depth analysis detailing your home's value as well as a comparison with similar homes in the area
Home Values in the Area
Average Home Value in this Area
Purchase History
| Date | Buyer | Sale Price | Title Company |
|---|---|---|---|
| William Mellick Trust | -- | None Available | |
| Mellick William H | -- | Lsi | |
| Mellick William H | -- | American Title Co |
Source: Public Records
Mortgage History
| Date | Status | Borrower | Loan Amount |
|---|---|---|---|
| Open | Mellick William H | $360,000 | |
| Closed | Mellick William H | $210,400 |
Source: Public Records
Tax History Compared to Growth
Tax History
| Year | Tax Paid | Tax Assessment Tax Assessment Total Assessment is a certain percentage of the fair market value that is determined by local assessors to be the total taxable value of land and additions on the property. | Land | Improvement |
|---|---|---|---|---|
| 2025 | $5,876 | $528,519 | $339,768 | $188,751 |
| 2024 | $5,876 | $518,156 | $333,106 | $185,050 |
| 2023 | $5,735 | $507,997 | $326,575 | $181,422 |
| 2022 | $5,677 | $498,037 | $320,172 | $177,865 |
| 2021 | $5,564 | $488,272 | $313,894 | $174,378 |
| 2020 | $5,552 | $483,266 | $310,676 | $172,590 |
| 2019 | $5,420 | $473,791 | $304,585 | $169,206 |
| 2018 | $5,208 | $464,501 | $298,612 | $165,889 |
| 2017 | $5,115 | $455,394 | $292,757 | $162,637 |
| 2016 | $5,006 | $446,465 | $287,016 | $159,449 |
| 2015 | $4,868 | $439,759 | $282,705 | $157,054 |
| 2014 | $4,718 | $431,145 | $277,167 | $153,978 |
Source: Public Records
Map
Nearby Homes
- 1020 La Serna Ave
- 1320 Marlei Rd
- 1421 Launer Dr
- 1230 Sunbird Ave
- 188 Madelena Dr
- 320 -330 Monte Vista
- 1000 Dolores St
- 421 N Marian St
- 9422 Canfield Dr
- 401 Granada Dr
- 950 N Walnut St
- 501 Willow St
- 581 W Greenwood Ave Unit 6
- 9331 Mikinda Ave
- 9915 Corella Ave
- 1620 W El Portal Dr
- 16875 Sausalito Dr
- 2100 Gregory Ln
- 506 Dorothea Rd
- 161 W Hidden Ln