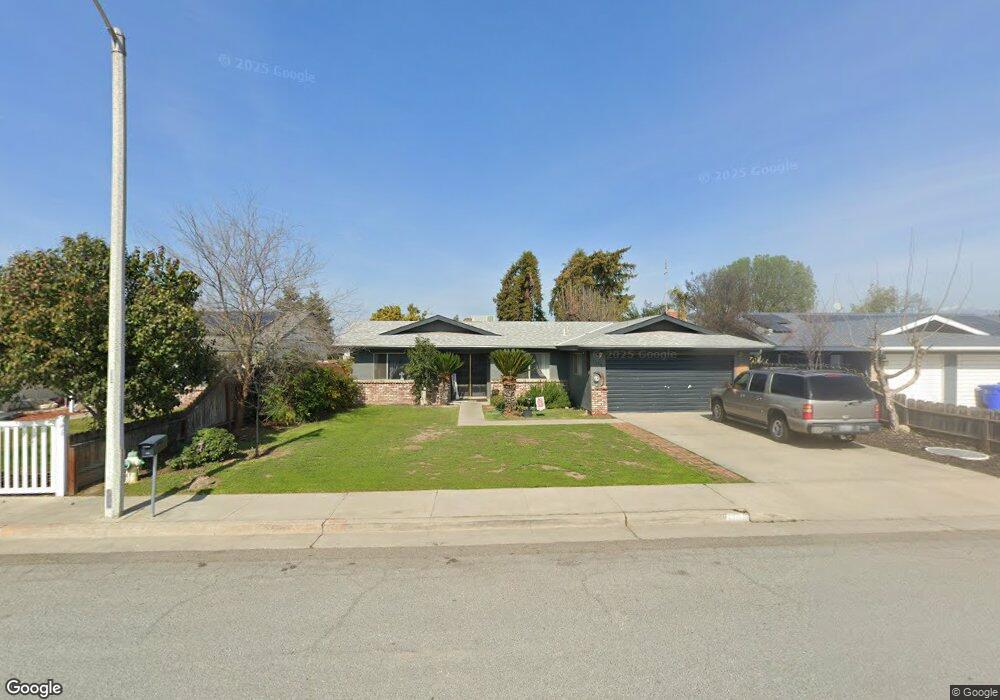
1150 San Lucia Ave Porterville, CA 93257
Porterville Northwest NeighborhoodEstimated Value: $337,000 - $374,000
3
Beds
3
Baths
1,644
Sq Ft
$212/Sq Ft
Est. Value
About This Home
This home is located at 1150 San Lucia Ave, Porterville, CA 93257 and is currently estimated at $347,949, approximately $211 per square foot. 1150 San Lucia Ave is a home located in Tulare County with nearby schools including Westfield Elementary School, Sequoia Middle School, and Monache High School.
Ownership History
Date
Name
Owned For
Owner Type
Purchase Details
Closed on
Sep 10, 2021
Sold by
Davis Gary Richard
Bought by
Dunn Lisa A
Current Estimated Value
Home Financials for this Owner
Home Financials are based on the most recent Mortgage that was taken out on this home.
Original Mortgage
$216,015
Interest Rate
2.8%
Mortgage Type
FHA
Purchase Details
Closed on
Aug 13, 2021
Sold by
Bentz Carol A and Estate Of James Richard Bentz
Bought by
Dunn Lisa A
Home Financials for this Owner
Home Financials are based on the most recent Mortgage that was taken out on this home.
Original Mortgage
$216,015
Interest Rate
2.8%
Mortgage Type
FHA
Purchase Details
Closed on
Jul 12, 2005
Sold by
Bentz Arlene C
Bought by
Bentz James R and Bentz Teresa K
Purchase Details
Closed on
Jul 8, 1994
Sold by
Hann David
Bought by
Bentz Arlene C
Home Financials for this Owner
Home Financials are based on the most recent Mortgage that was taken out on this home.
Original Mortgage
$80,800
Interest Rate
5.65%
Create a Home Valuation Report for This Property
The Home Valuation Report is an in-depth analysis detailing your home's value as well as a comparison with similar homes in the area
Home Values in the Area
Average Home Value in this Area
Purchase History
| Date | Buyer | Sale Price | Title Company |
|---|---|---|---|
| Dunn Lisa A | -- | Chicago Title Company | |
| Dunn Lisa A | $220,000 | Chicago Title Company | |
| Bentz James R | $70,000 | Stewart Title Of California | |
| Bentz Arlene C | $101,000 | Chicago Title Company |
Source: Public Records
Mortgage History
| Date | Status | Borrower | Loan Amount |
|---|---|---|---|
| Previous Owner | Dunn Lisa A | $216,015 | |
| Previous Owner | Bentz Arlene C | $80,800 |
Source: Public Records
Tax History Compared to Growth
Tax History
| Year | Tax Paid | Tax Assessment Tax Assessment Total Assessment is a certain percentage of the fair market value that is determined by local assessors to be the total taxable value of land and additions on the property. | Land | Improvement |
|---|---|---|---|---|
| 2025 | $3,032 | $285,463 | $58,366 | $227,097 |
| 2024 | $3,032 | $279,867 | $57,222 | $222,645 |
| 2023 | $3,029 | $274,380 | $56,100 | $218,280 |
| 2022 | $2,351 | $215,492 | $42,047 | $173,445 |
| 2021 | $2,324 | $211,267 | $41,223 | $170,044 |
| 2020 | $1,706 | $155,129 | $38,398 | $116,731 |
| 2019 | $1,675 | $152,087 | $37,645 | $114,442 |
| 2018 | $1,645 | $149,105 | $36,907 | $112,198 |
| 2017 | $1,605 | $146,181 | $36,183 | $109,998 |
| 2016 | $1,540 | $143,315 | $35,474 | $107,841 |
| 2015 | $1,481 | $141,162 | $34,941 | $106,221 |
| 2014 | $1,481 | $138,397 | $34,257 | $104,140 |
Source: Public Records
Map
Nearby Homes
- 1045 N Westside St
- 1076 N Beverly St
- 1245 Atkins St
- 1089 Pioneer Ave
- 1121 N Lindale Way
- 1370 Lindale Place
- 700 N Prospect St
- 829 Pioneer Ave
- 1421 Pamela Cir
- 640 N Prospect St
- 793 Pioneer Ave
- 681 W Mulberry Ave
- 680 W Gerry Cir
- 1041 Greenfield Dr
- 701 W Theta Ave
- 701 Theta Ave
- 1450 W Brian Ln
- 927 Shadowood Place
- 1681 W Wall Ln
- 1691 Terry Ct
- 1160 San Lucia Ave
- 1140 San Lucia Ave
- 1155 Jean Ave
- 1170 San Lucia Ave
- 1130 San Lucia Ave
- 1145 Jean Ave
- 1165 Jean Ave
- 1135 Jean Ave
- 1102 N Maston St
- 1181 San Lucia Ave
- 1175 Jean Ave
- 1120 San Lucia Ave
- 1175 W Jean Ave
- 1190 San Lucia Ave
- 1130 N Prospect St
- 1101 Douglas St
- 1185 Jean Ave
- 1095 N Maston St
- 1150 N Maston St
- 1160 Jean Ave