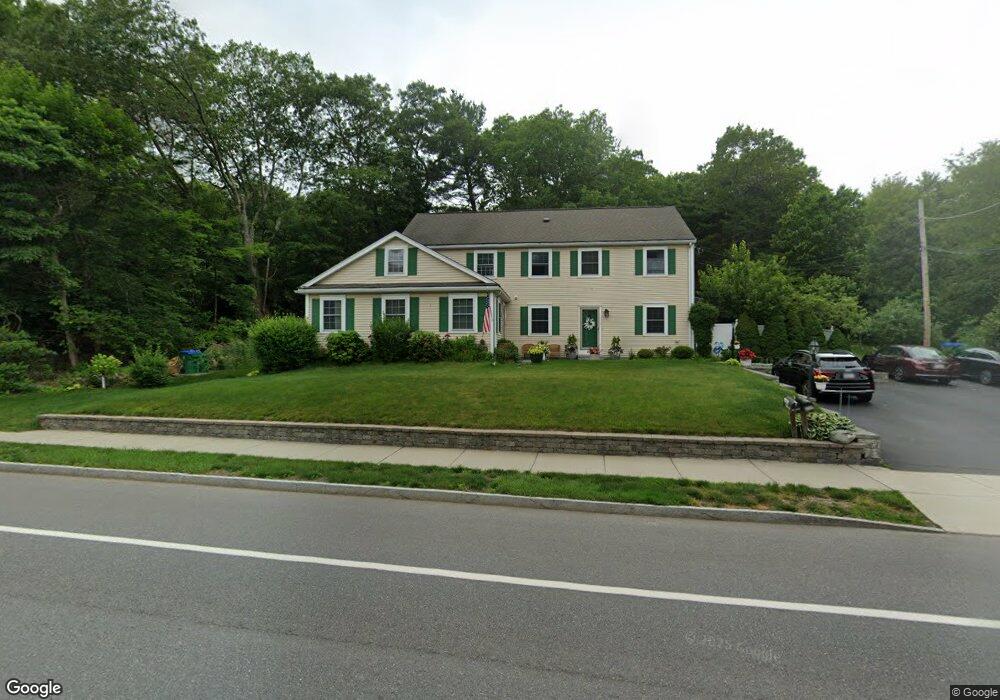
1151 High St Unit 1 Westwood, MA 02090
Estimated Value: $403,000 - $1,597,000
3
Beds
3
Baths
1,560
Sq Ft
$530/Sq Ft
Est. Value
About This Home
This home is located at 1151 High St Unit 1, Westwood, MA 02090 and is currently estimated at $826,227, approximately $529 per square foot. 1151 High St Unit 1 is a home located in Norfolk County with nearby schools including Westwood High School, St Catherine Of Siena School, and Xaverian Brothers High School.
Ownership History
Date
Name
Owned For
Owner Type
Purchase Details
Closed on
Jun 28, 2002
Sold by
Norwood Sportswear Inc
Bought by
Pogace Edmond and Pogace Ilda
Current Estimated Value
Home Financials for this Owner
Home Financials are based on the most recent Mortgage that was taken out on this home.
Original Mortgage
$264,000
Outstanding Balance
$113,580
Interest Rate
6.92%
Mortgage Type
Purchase Money Mortgage
Estimated Equity
$712,647
Purchase Details
Closed on
Jun 26, 2001
Sold by
Cameron D Brian
Bought by
Norwood Sportswear Inc
Create a Home Valuation Report for This Property
The Home Valuation Report is an in-depth analysis detailing your home's value as well as a comparison with similar homes in the area
Home Values in the Area
Average Home Value in this Area
Purchase History
| Date | Buyer | Sale Price | Title Company |
|---|---|---|---|
| Pogace Edmond | $330,000 | -- | |
| Ikonomi Piro | $330,000 | -- | |
| Norwood Sportswear Inc | $185,000 | -- |
Source: Public Records
Mortgage History
| Date | Status | Borrower | Loan Amount |
|---|---|---|---|
| Open | Ikonomi Piro | $264,000 | |
| Closed | Pogace Edmond | $264,000 | |
| Previous Owner | Norwood Sportswear Inc | $118,500 | |
| Previous Owner | Norwood Sportswear Inc | $95,000 |
Source: Public Records
Tax History Compared to Growth
Tax History
| Year | Tax Paid | Tax Assessment Tax Assessment Total Assessment is a certain percentage of the fair market value that is determined by local assessors to be the total taxable value of land and additions on the property. | Land | Improvement |
|---|---|---|---|---|
| 2025 | $4,439 | $346,800 | $0 | $346,800 |
| 2024 | $4,291 | $335,000 | $0 | $335,000 |
| 2023 | $4,333 | $303,000 | $0 | $303,000 |
| 2022 | $4,559 | $307,400 | $0 | $307,400 |
| 2021 | $4,608 | $311,800 | $0 | $311,800 |
| 2020 | $4,420 | $304,650 | $0 | $304,650 |
| 2019 | $4,525 | $308,850 | $0 | $308,850 |
| 2018 | $4,725 | $313,100 | $0 | $313,100 |
| 2017 | $4,234 | $290,600 | $0 | $290,600 |
| 2016 | $4,019 | $274,150 | $0 | $274,150 |
| 2015 | $4,233 | $277,750 | $0 | $277,750 |
Source: Public Records
Map
Nearby Homes