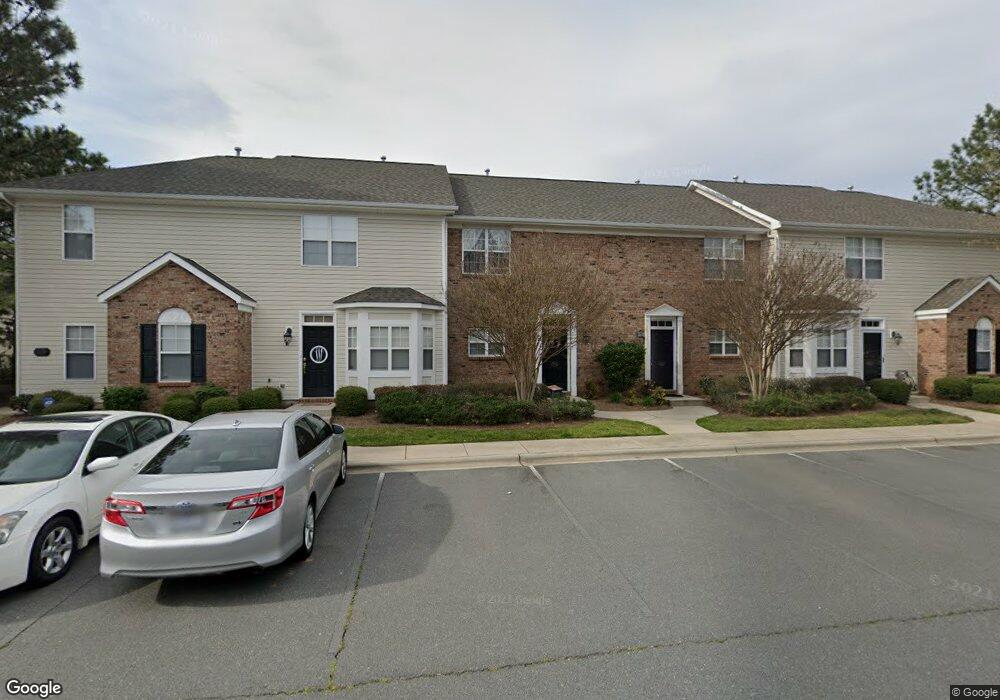
11522 Savannah Creek Dr Charlotte, NC 28273
Yorkshire NeighborhoodEstimated Value: $234,000 - $256,922
2
Beds
3
Baths
1,132
Sq Ft
$218/Sq Ft
Est. Value
About This Home
This home is located at 11522 Savannah Creek Dr, Charlotte, NC 28273 and is currently estimated at $246,231, approximately $217 per square foot. 11522 Savannah Creek Dr is a home located in Mecklenburg County with nearby schools including Lake Wylie Elementary School, Southwest Middle School, and Unity Classical Charter School.
Ownership History
Date
Name
Owned For
Owner Type
Purchase Details
Closed on
May 11, 2016
Sold by
Tomblin Jenah and Tomblin Michael
Bought by
St Onge Catherine A
Current Estimated Value
Home Financials for this Owner
Home Financials are based on the most recent Mortgage that was taken out on this home.
Original Mortgage
$108,840
Outstanding Balance
$86,446
Interest Rate
3.59%
Mortgage Type
New Conventional
Estimated Equity
$159,785
Purchase Details
Closed on
Feb 11, 2015
Sold by
Digregoiro Jenah A and Tomblin Michael
Bought by
Tomblin Jenah and Tomblin Michael
Purchase Details
Closed on
Dec 9, 2003
Sold by
Savannah Townhomes Llc
Bought by
Digregorio Jenah A
Home Financials for this Owner
Home Financials are based on the most recent Mortgage that was taken out on this home.
Original Mortgage
$18,000
Interest Rate
6.05%
Mortgage Type
Credit Line Revolving
Create a Home Valuation Report for This Property
The Home Valuation Report is an in-depth analysis detailing your home's value as well as a comparison with similar homes in the area
Home Values in the Area
Average Home Value in this Area
Purchase History
| Date | Buyer | Sale Price | Title Company |
|---|---|---|---|
| St Onge Catherine A | $112,000 | None Available | |
| Tomblin Jenah | -- | None Available | |
| Digregorio Jenah A | $109,000 | -- |
Source: Public Records
Mortgage History
| Date | Status | Borrower | Loan Amount |
|---|---|---|---|
| Open | St Onge Catherine A | $108,840 | |
| Previous Owner | Digregorio Jenah A | $18,000 | |
| Previous Owner | Digregorio Jenah A | $68,900 |
Source: Public Records
Tax History Compared to Growth
Tax History
| Year | Tax Paid | Tax Assessment Tax Assessment Total Assessment is a certain percentage of the fair market value that is determined by local assessors to be the total taxable value of land and additions on the property. | Land | Improvement |
|---|---|---|---|---|
| 2025 | $2,020 | $246,500 | $60,000 | $186,500 |
| 2024 | $2,020 | $246,500 | $60,000 | $186,500 |
| 2023 | $1,947 | $246,500 | $60,000 | $186,500 |
| 2022 | $1,455 | $137,800 | $40,000 | $97,800 |
| 2021 | $1,444 | $137,800 | $40,000 | $97,800 |
| 2020 | $1,437 | $137,800 | $40,000 | $97,800 |
| 2019 | $1,421 | $137,800 | $40,000 | $97,800 |
| 2018 | $1,118 | $79,600 | $15,000 | $64,600 |
| 2017 | $1,093 | $79,600 | $15,000 | $64,600 |
| 2016 | $1,084 | $79,600 | $15,000 | $64,600 |
| 2015 | $1,072 | $79,600 | $15,000 | $64,600 |
| 2014 | $1,061 | $83,200 | $15,000 | $68,200 |
Source: Public Records
Map
Nearby Homes
- 11548 Savannah Creek Dr
- 11521 Savannah Creek Dr
- 13332 Savannah Club Dr
- 14722 Lions Pride Ct
- 14755 Lions Paw St
- 15005 Savannah Hall Dr Unit Lot 72
- 12408 Savannah Cottage Dr
- 14640 Lions Paw St
- 13310 Erwin Rd
- 13443 Kibworth Ln
- 12308 Verdant Ct Unit 10D
- 11314 Bumpious Ct
- 12039 Windy Rock Way
- 13116 Erwin Rd
- 11320 Wagonford Ln
- 11628 Eastwind Dr
- 10867 Garden Oaks Ln
- 11440 Laurel View Dr
- 13421 Bolingbrook Ln
- 13308 Bolingbrook Ln
- 11522 Savannah Creek Dr Unit 33
- 11528 Savannah Creek Dr
- 11518 Savannah Creek Dr
- 11514 Savannah Creek Dr
- 11514 Savannah Creek Dr Unit 11514
- 11532 Savannah Creek Dr
- 11532 Savannah Creek Dr Unit 11532
- 11510 Savannah Creek Dr
- 11540 Savannah Creek Dr
- 12230 Savannah Garden Dr
- 12230 Savannah Garden Dr Unit 12230
- 12234 Savannah Garden Dr
- 12224 Savannah Garden Dr
- 12238 Savannah Garden Dr
- 11544 Savannah Creek Dr
- 12220 Savannah Garden Dr Unit 17
- 12220 Savannah Garden Dr
- 12216 Savannah Garden Dr
- 12246 Savannah Garden Dr
- 12212 Savannah Garden Dr