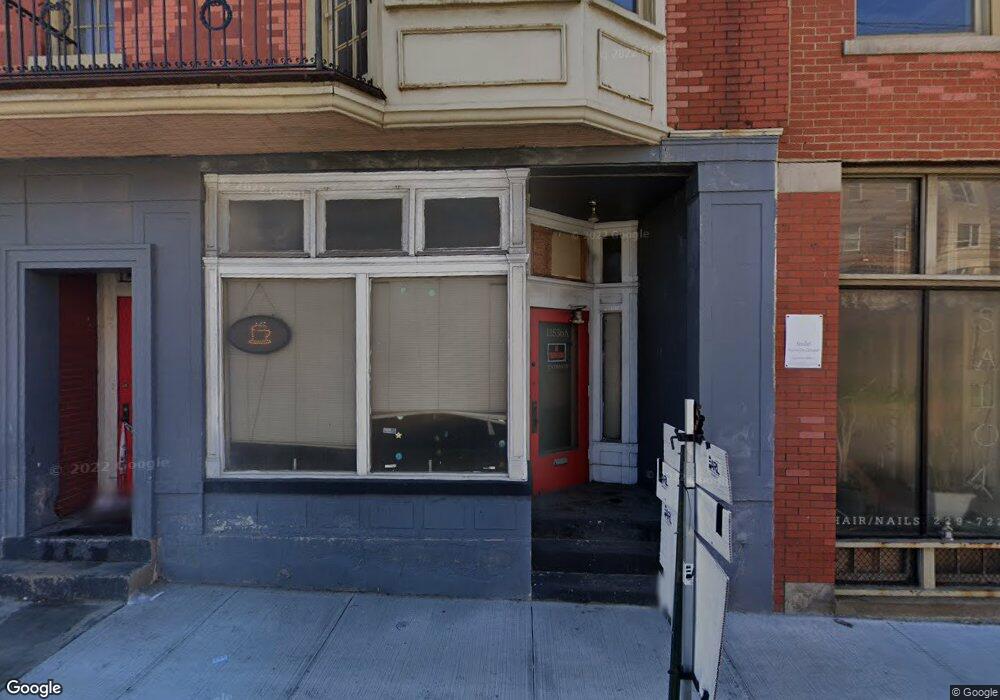
11526 Buckeye Rd Cleveland, OH 44104
Woodland Hills NeighborhoodEstimated Value: $110,219
--
Bed
4
Baths
7,311
Sq Ft
$15/Sq Ft
Est. Value
About This Home
This home is located at 11526 Buckeye Rd, Cleveland, OH 44104 and is currently estimated at $110,219, approximately $15 per square foot. 11526 Buckeye Rd is a home located in Cuyahoga County with nearby schools including Bolton, Andrew J. Rickoff School, and Anton Grdina School.
Ownership History
Date
Name
Owned For
Owner Type
Purchase Details
Closed on
Mar 1, 2022
Sold by
Buckeye Area Cleveland Development Corpo
Bought by
Three Black Knights Llc
Current Estimated Value
Purchase Details
Closed on
Mar 1, 2000
Sold by
Buckeye Area Development Corp
Bought by
Buckeye Area Cleveland Development Corp
Home Financials for this Owner
Home Financials are based on the most recent Mortgage that was taken out on this home.
Original Mortgage
$100,000
Interest Rate
8.21%
Mortgage Type
Commercial
Purchase Details
Closed on
Feb 24, 2000
Sold by
New Buckeye Area and Redevelopment Corpor
Bought by
Buckeye Area Development Corp
Home Financials for this Owner
Home Financials are based on the most recent Mortgage that was taken out on this home.
Original Mortgage
$100,000
Interest Rate
8.21%
Mortgage Type
Commercial
Purchase Details
Closed on
Jan 1, 1975
Bought by
Bloom Bros Enterprises Inc
Create a Home Valuation Report for This Property
The Home Valuation Report is an in-depth analysis detailing your home's value as well as a comparison with similar homes in the area
Home Values in the Area
Average Home Value in this Area
Purchase History
| Date | Buyer | Sale Price | Title Company |
|---|---|---|---|
| Three Black Knights Llc | $88,000 | Guardian Title | |
| Buckeye Area Cleveland Development Corp | -- | Rockwell Title Agency Inc | |
| Buckeye Area Development Corp | -- | Rockwell Title Agency Inc | |
| Bloom Bros Enterprises Inc | -- | -- |
Source: Public Records
Mortgage History
| Date | Status | Borrower | Loan Amount |
|---|---|---|---|
| Previous Owner | Buckeye Area Development Corp | $100,000 |
Source: Public Records
Tax History Compared to Growth
Tax History
| Year | Tax Paid | Tax Assessment Tax Assessment Total Assessment is a certain percentage of the fair market value that is determined by local assessors to be the total taxable value of land and additions on the property. | Land | Improvement |
|---|---|---|---|---|
| 2024 | $7,847 | $50,260 | $5,005 | $45,255 |
| 2023 | $5,897 | $59,050 | $5,500 | $53,550 |
| 2022 | $5,889 | $59,050 | $5,500 | $53,550 |
| 2021 | $5,907 | $59,050 | $5,500 | $53,550 |
| 2020 | $5,582 | $53,690 | $5,010 | $48,690 |
| 2019 | $5,256 | $153,400 | $14,300 | $139,100 |
| 2018 | $5,125 | $53,690 | $5,010 | $48,690 |
| 2017 | $4,391 | $43,230 | $3,990 | $39,240 |
| 2016 | $4,393 | $43,230 | $3,990 | $39,240 |
| 2015 | $5,467 | $43,230 | $3,990 | $39,240 |
| 2014 | $5,467 | $54,050 | $5,010 | $49,040 |
Source: Public Records
Map
Nearby Homes
- 2827 E 117th St
- 2940 E 115th St
- 11430 Methyl Ave
- 2785 E 117th St
- 2778 E 118th St
- 2838 E 120th St
- 2801 E 119th St
- 11206 Forest Ave
- 11202 Forest Ave
- 11119 Forest Ave
- 2934 E 123rd St
- 2823 E 124th St
- 12004 Continental Ave
- 12008 Continental Ave
- 11325 Melba Ave
- 12511 Forest Ave
- 12029 Griffing Ave
- 3022 E 125th St
- 11116 Lardet Ave
- 11916 Browning Ave
- 2875 E 115
- 2875 E 115th St
- 2889 E 115th St
- 2885 E 115th St
- 2893 E 115th St
- 11622 Buckeye Rd
- 11624 Buckeye Rd
- 2899 E 115th St
- 2888 E 117th St
- 2849 E 116th St
- 2892 E 117th St
- 2908 E 116th St
- 2845 E 116th St
- 2894 E 117th St
- 11702 Buckeye Rd
- 11515 Harvey Ave
- 2903 E 115th St
- 2898 E 117th St
- 2836 E 117th St
- 2841 E 116th St