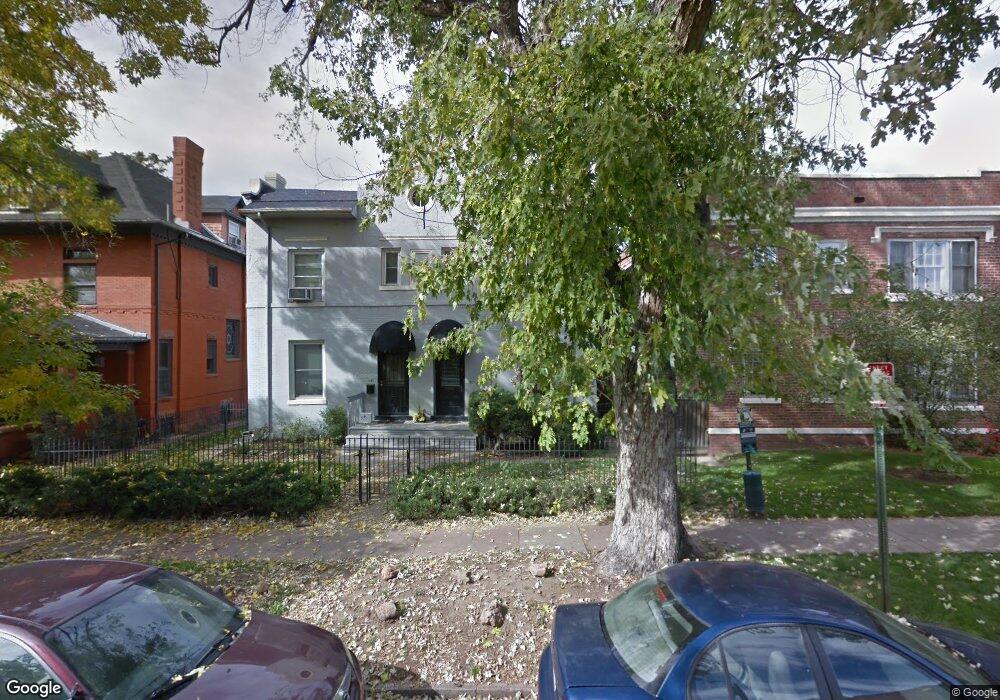
1153 Clarkson St Denver, CO 80218
Capitol Hill NeighborhoodEstimated Value: $670,507 - $763,000
3
Beds
2
Baths
1,544
Sq Ft
$466/Sq Ft
Est. Value
About This Home
This home is located at 1153 Clarkson St, Denver, CO 80218 and is currently estimated at $719,877, approximately $466 per square foot. 1153 Clarkson St is a home located in Denver County with nearby schools including Dora Moore ECE-8 School, Morey Middle School, and East High School.
Ownership History
Date
Name
Owned For
Owner Type
Purchase Details
Closed on
Apr 22, 2022
Sold by
Yarmony Partners Ltd
Bought by
Meyer Allison
Current Estimated Value
Home Financials for this Owner
Home Financials are based on the most recent Mortgage that was taken out on this home.
Original Mortgage
$400,000
Outstanding Balance
$378,953
Interest Rate
5.11%
Mortgage Type
New Conventional
Estimated Equity
$340,924
Purchase Details
Closed on
Apr 8, 2021
Sold by
Yarmony Partners Ltd
Bought by
Fagan Philip P
Home Financials for this Owner
Home Financials are based on the most recent Mortgage that was taken out on this home.
Original Mortgage
$441,000
Interest Rate
2.9%
Mortgage Type
New Conventional
Purchase Details
Closed on
Apr 6, 2021
Sold by
Fagan Philip P
Bought by
Yarmony Partners Ltd
Home Financials for this Owner
Home Financials are based on the most recent Mortgage that was taken out on this home.
Original Mortgage
$441,000
Interest Rate
2.9%
Mortgage Type
New Conventional
Purchase Details
Closed on
Oct 7, 2016
Sold by
Fagan Philip P and Mckay Joanne
Bought by
Fagan Philip P
Home Financials for this Owner
Home Financials are based on the most recent Mortgage that was taken out on this home.
Original Mortgage
$417,000
Interest Rate
3.46%
Mortgage Type
VA
Purchase Details
Closed on
Feb 23, 2015
Sold by
Fagan Philip P
Bought by
Fagan Philip P and Mckay Joanne
Purchase Details
Closed on
Dec 18, 2014
Sold by
Stuart Sandra Lee and Jaffe Mark S
Bought by
Fagan Phillip P
Home Financials for this Owner
Home Financials are based on the most recent Mortgage that was taken out on this home.
Original Mortgage
$430,761
Interest Rate
4.01%
Mortgage Type
VA
Purchase Details
Closed on
May 19, 2010
Sold by
Bolster Martijn H
Bought by
Stuart Sandra Lee and Jaffe Mark S
Home Financials for this Owner
Home Financials are based on the most recent Mortgage that was taken out on this home.
Original Mortgage
$261,971
Interest Rate
4.87%
Mortgage Type
FHA
Purchase Details
Closed on
Jun 9, 2008
Sold by
The John C & Martha S Birney 2007 Charit
Bought by
Bolster Martijn H
Home Financials for this Owner
Home Financials are based on the most recent Mortgage that was taken out on this home.
Original Mortgage
$216,000
Interest Rate
6.07%
Mortgage Type
Purchase Money Mortgage
Purchase Details
Closed on
Aug 1, 2007
Sold by
Birney John C and Birney Martha S
Bought by
The John C & Martha S Birney 2007 Charit
Purchase Details
Closed on
May 1, 2002
Sold by
Birney John C and Birney Martha S
Bought by
1153 Clarkson Street Llc
Create a Home Valuation Report for This Property
The Home Valuation Report is an in-depth analysis detailing your home's value as well as a comparison with similar homes in the area
Home Values in the Area
Average Home Value in this Area
Purchase History
| Date | Buyer | Sale Price | Title Company |
|---|---|---|---|
| Meyer Allison | $766,000 | First American Title | |
| Fagan Philip P | -- | Capital Title | |
| Yarmony Partners Ltd | -- | Avalanche T&E Inc | |
| Fagan Philip P | -- | None Available | |
| Fagan Philip P | -- | Land Title Guarantee Company | |
| Fagan Phillip P | $425,000 | Land Title Guarantee Company | |
| Stuart Sandra Lee | $265,500 | Utc Colorado | |
| Bolster Martijn H | $270,000 | Chicago Title Co | |
| The John C & Martha S Birney 2007 Charit | -- | None Available | |
| Birney John C | -- | None Available | |
| 1153 Clarkson Street Llc | -- | -- |
Source: Public Records
Mortgage History
| Date | Status | Borrower | Loan Amount |
|---|---|---|---|
| Open | Meyer Allison | $400,000 | |
| Previous Owner | Fagan Philip P | $441,000 | |
| Previous Owner | Fagan Philip P | $417,000 | |
| Previous Owner | Fagan Phillip P | $430,761 | |
| Previous Owner | Stuart Sandra Lee | $261,971 | |
| Previous Owner | Bolster Martijn H | $216,000 |
Source: Public Records
Tax History Compared to Growth
Tax History
| Year | Tax Paid | Tax Assessment Tax Assessment Total Assessment is a certain percentage of the fair market value that is determined by local assessors to be the total taxable value of land and additions on the property. | Land | Improvement |
|---|---|---|---|---|
| 2024 | $3,479 | $43,920 | $11,240 | $32,680 |
| 2023 | $3,403 | $43,920 | $11,240 | $32,680 |
| 2022 | $2,941 | $36,980 | $15,480 | $21,500 |
| 2021 | $2,838 | $38,030 | $15,920 | $22,110 |
| 2020 | $2,526 | $34,040 | $14,930 | $19,110 |
| 2019 | $2,455 | $34,040 | $14,930 | $19,110 |
| 2018 | $2,604 | $33,660 | $14,030 | $19,630 |
| 2017 | $2,596 | $33,660 | $14,030 | $19,630 |
| 2016 | $2,539 | $31,140 | $14,400 | $16,740 |
| 2015 | $2,433 | $31,140 | $14,400 | $16,740 |
| 2014 | $1,990 | $23,960 | $7,976 | $15,984 |
Source: Public Records
Map
Nearby Homes
- 1125 N Washington St Unit 501
- 1125 N Washington St Unit 206
- 1125 N Washington St Unit 602
- 1225 N Clarkson St
- 1113 N Washington St
- 1215 N Emerson St Unit A
- 1225 N Emerson St Unit B
- 1214 N Pearl St Unit 1
- 1060 N Washington St Unit 1A
- 1243 N Washington St Unit 308
- 1243 N Washington St Unit 406
- 1243 N Washington St Unit 105
- 1045 N Clarkson St Unit 102
- 1057 N Emerson St Unit B
- 1233 N Ogden St Unit 503
- 1233 N Ogden St Unit 312
- 550 E 12th Ave Unit 907
- 550 E 12th Ave Unit 1706
- 550 E 12th Ave Unit 506
- 1266 N Pearl St
- 1151 Clarkson St
- 1145 Clarkson St
- 720 E 12th Ave
- 1139 Clarkson St
- 730 E 12th Ave
- 1148 N Washington St
- 1133 Clarkson St
- 1142 Washington St
- 1154 Clarkson St
- 1136 Washington St
- 1136 N Washington St
- 1140 Clarkson St
- 1125 Clarkson St
- 1146 Clarkson St
- 1138 Clarkson St
- 1132 Washington St
- 810 E 12th Ave
- 1138 N Clarkson St
- 555 N Clarkson St
- 555-561 N Clarkson St