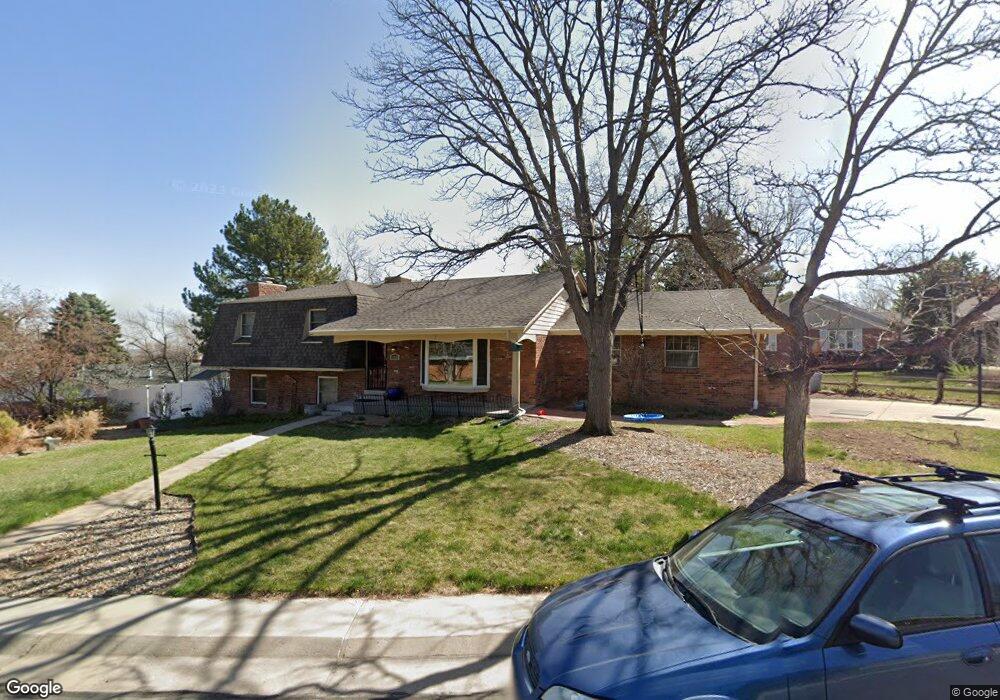
11537 W 26th Place Lakewood, CO 80215
Applewood Valley NeighborhoodEstimated Value: $854,000 - $1,016,000
4
Beds
3
Baths
2,834
Sq Ft
$326/Sq Ft
Est. Value
About This Home
This home is located at 11537 W 26th Place, Lakewood, CO 80215 and is currently estimated at $923,543, approximately $325 per square foot. 11537 W 26th Place is a home located in Jefferson County with nearby schools including Prospect Valley Elementary School, Everitt Middle School, and Wheat Ridge High School.
Ownership History
Date
Name
Owned For
Owner Type
Purchase Details
Closed on
Oct 30, 2017
Sold by
Ward Timohty L and Ward Hollis E
Bought by
Frey Richard D and Wright Dianne Cady
Current Estimated Value
Home Financials for this Owner
Home Financials are based on the most recent Mortgage that was taken out on this home.
Original Mortgage
$491,832
Outstanding Balance
$411,367
Interest Rate
3.78%
Mortgage Type
New Conventional
Estimated Equity
$512,176
Purchase Details
Closed on
Feb 12, 2002
Sold by
Gregory Vicki A
Bought by
Ward Timothy L and Ward Hollis E
Purchase Details
Closed on
Jun 15, 2000
Sold by
Sigg Judy A
Bought by
Ward Timothy L and Ward Hollis E
Home Financials for this Owner
Home Financials are based on the most recent Mortgage that was taken out on this home.
Original Mortgage
$240,000
Interest Rate
8.36%
Purchase Details
Closed on
Sep 30, 1997
Sold by
Sigg Ronald G
Bought by
Sigg Judy A
Create a Home Valuation Report for This Property
The Home Valuation Report is an in-depth analysis detailing your home's value as well as a comparison with similar homes in the area
Home Values in the Area
Average Home Value in this Area
Purchase History
| Date | Buyer | Sale Price | Title Company |
|---|---|---|---|
| Frey Richard D | $540,000 | Land Title Gurantee Company | |
| Ward Timothy L | -- | -- | |
| Ward Timothy L | $320,000 | Stewart Title | |
| Sigg Judy A | -- | -- |
Source: Public Records
Mortgage History
| Date | Status | Borrower | Loan Amount |
|---|---|---|---|
| Open | Frey Richard D | $491,832 | |
| Previous Owner | Ward Timothy L | $240,000 |
Source: Public Records
Tax History Compared to Growth
Tax History
| Year | Tax Paid | Tax Assessment Tax Assessment Total Assessment is a certain percentage of the fair market value that is determined by local assessors to be the total taxable value of land and additions on the property. | Land | Improvement |
|---|---|---|---|---|
| 2024 | $5,129 | $53,840 | $24,074 | $29,766 |
| 2023 | $5,129 | $53,840 | $24,074 | $29,766 |
| 2022 | $4,233 | $43,239 | $17,143 | $26,096 |
| 2021 | $4,268 | $44,483 | $17,636 | $26,847 |
| 2020 | $3,818 | $39,824 | $13,798 | $26,026 |
| 2019 | $3,769 | $39,824 | $13,798 | $26,026 |
| 2018 | $3,861 | $39,796 | $11,823 | $27,973 |
| 2017 | $3,471 | $39,796 | $11,823 | $27,973 |
| 2016 | $2,750 | $29,691 | $8,152 | $21,539 |
| 2015 | $2,886 | $30,918 | $8,152 | $22,766 |
| 2014 | $2,886 | $28,371 | $7,794 | $20,577 |
Source: Public Records
Map
Nearby Homes
- 11569 W 27th Ave
- 11340 Benthaven Dr
- 11734 W Applewood Knolls Dr
- 11144 W 27th Ave
- 11542 W 29th Place
- 11954 W Applewood Knolls Dr
- 11820 W 30th Place
- 2615 Oak Dr Unit 40
- 12000 W 29th Place
- 3086 Parfet Dr
- 2140 Tabor Dr
- 11760 W 32nd Ave
- 3229 Swadley St
- 2110 Tabor Dr
- 3251 Robb St
- 2055 Quail Dr
- 2368 Ward Dr
- 3322 Simms St
- 3127 Nelson Ct
- 22 Rangeview Dr
- 11497 W 26th Place
- 11548 W 27th Ave
- 11538 W 27th Ave
- 11546 W 26th Place
- 11458 W 27th Ave
- 11536 W 26th Place
- 11437 W 26th Place
- 11558 W 27th Ave
- 11516 W 26th Place
- 11506 W 26th Place
- 11476 W 26th Place
- 11388 W 27th Ave
- 11549 W 27th Ave
- 11387 W 26th Place
- 2670 Simms St
- 2650 Simms St
- 11459 W 27th Ave
- 11559 W 27th Ave
- 11436 W 26th Place
- 2690 Simms St