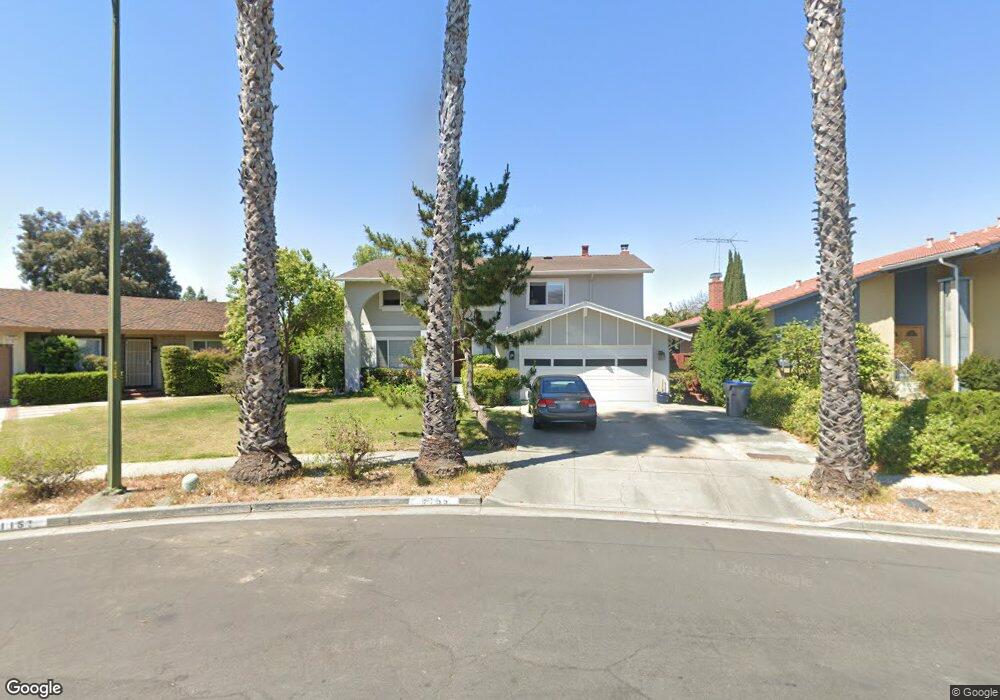
1155 Braemer Ct San Jose, CA 95132
Saint Victor NeighborhoodEstimated Value: $1,863,634 - $2,192,000
4
Beds
3
Baths
2,428
Sq Ft
$843/Sq Ft
Est. Value
About This Home
This home is located at 1155 Braemer Ct, San Jose, CA 95132 and is currently estimated at $2,045,659, approximately $842 per square foot. 1155 Braemer Ct is a home located in Santa Clara County with nearby schools including Ruskin Elementary School, Sierramont Middle School, and Piedmont Hills High School.
Ownership History
Date
Name
Owned For
Owner Type
Purchase Details
Closed on
Jan 31, 2013
Sold by
Chou Phidias Cheng Hsien
Bought by
Chou Phidias Cheng Hsien and Chou Phoenix
Current Estimated Value
Purchase Details
Closed on
Feb 16, 2011
Sold by
Chou Phoenix W
Bought by
Chou Phidias Cheng Hsien
Home Financials for this Owner
Home Financials are based on the most recent Mortgage that was taken out on this home.
Original Mortgage
$164,000
Outstanding Balance
$111,634
Interest Rate
4.67%
Mortgage Type
New Conventional
Estimated Equity
$1,934,025
Purchase Details
Closed on
May 6, 1997
Sold by
Lewis Donna M and Lewis Thomas C
Bought by
Chou Phidias Cheng Hsien and Chou Phoenix W
Home Financials for this Owner
Home Financials are based on the most recent Mortgage that was taken out on this home.
Original Mortgage
$247,500
Interest Rate
7.75%
Create a Home Valuation Report for This Property
The Home Valuation Report is an in-depth analysis detailing your home's value as well as a comparison with similar homes in the area
Home Values in the Area
Average Home Value in this Area
Purchase History
| Date | Buyer | Sale Price | Title Company |
|---|---|---|---|
| Chou Phidias Cheng Hsien | -- | None Available | |
| Chou Phidias Cheng Hsien | -- | Chicago Title Company | |
| Chou Phidias Cheng Hsien | $340,000 | American Title Co |
Source: Public Records
Mortgage History
| Date | Status | Borrower | Loan Amount |
|---|---|---|---|
| Open | Chou Phidias Cheng Hsien | $164,000 | |
| Closed | Chou Phidias Cheng Hsien | $247,500 |
Source: Public Records
Tax History Compared to Growth
Tax History
| Year | Tax Paid | Tax Assessment Tax Assessment Total Assessment is a certain percentage of the fair market value that is determined by local assessors to be the total taxable value of land and additions on the property. | Land | Improvement |
|---|---|---|---|---|
| 2025 | $8,403 | $553,730 | $211,718 | $342,012 |
| 2024 | $8,403 | $542,873 | $207,567 | $335,306 |
| 2023 | $8,240 | $532,230 | $203,498 | $328,732 |
| 2022 | $8,203 | $521,795 | $199,508 | $322,287 |
| 2021 | $7,927 | $511,565 | $195,597 | $315,968 |
| 2020 | $7,674 | $506,321 | $193,592 | $312,729 |
| 2019 | $7,381 | $496,395 | $189,797 | $306,598 |
| 2018 | $7,272 | $486,663 | $186,076 | $300,587 |
| 2017 | $7,307 | $477,122 | $182,428 | $294,694 |
| 2016 | $7,003 | $467,767 | $178,851 | $288,916 |
| 2015 | $6,919 | $460,742 | $176,165 | $284,577 |
| 2014 | $6,283 | $451,718 | $172,715 | $279,003 |
Source: Public Records
Map
Nearby Homes
- 3092 Halgrim Ct
- 2520 Amaryl Dr
- 1373 Ferrel Ct
- 1055 N Capitol Ave Unit 51
- 1055 N Capitol Ave Unit 124
- 1055 N Capitol Ave Unit 180
- 2966 Crater Ln
- Residence 3 Plan at Ascend
- Residence 1 Plan at Ascend
- Residence 2 Plan at Ascend
- 998 Harcot Ct
- 982 Harcot Ct
- 994 Harcot Ct
- 970 E Harcot Ct
- 990 Harcot Ct
- 931 ToMcOt Ct
- 3190 Vesuvius Ln
- 825 N Capitol Ave Unit 4
- 3308 Whitman Way
- 1103 Somerset Dr
- 1157 Braemer Ct
- 1151 Braemer Ct
- 1160 Morrill Ave
- 1168 Morrill Ave
- 1149 Braemer Ct
- 1161 Braemer Ct
- 1156 Morrill Ave
- 1172 Morrill Ave
- 1156 Braemer Ct
- 1163 Braemer Ct
- 1160 Braemer Ct
- 2785 Berryessa Rd
- 1176 Morrill Ave
- 2775 Berryessa Rd
- 1143 Braemer Ct
- 2795 Berryessa Rd
- 2765 Berryessa Rd
- 1162 Braemer Ct
- 2805 Berryessa Rd
- 1140 Braemer Ct