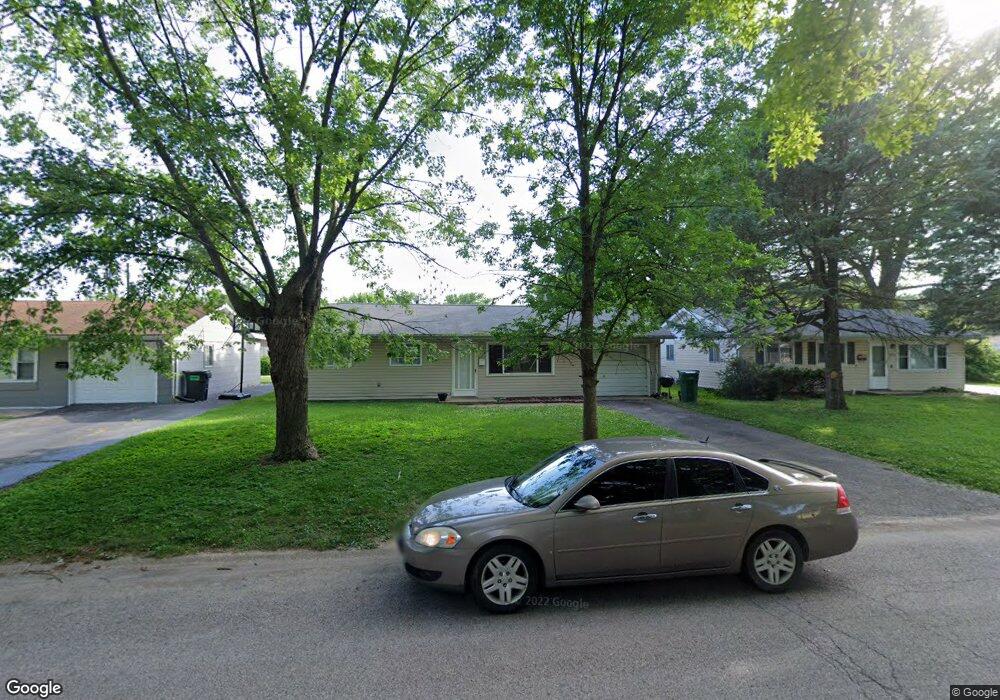
1156 Smith St East Saint Louis, IL 62206
Estimated Value: $72,000 - $83,000
--
Bed
--
Bath
936
Sq Ft
$82/Sq Ft
Est. Value
About This Home
This home is located at 1156 Smith St, East Saint Louis, IL 62206 and is currently estimated at $76,667, approximately $81 per square foot. 1156 Smith St is a home located in St. Clair County.
Ownership History
Date
Name
Owned For
Owner Type
Purchase Details
Closed on
Dec 30, 2021
Sold by
Hyp Llc
Bought by
Sari Holdings Llc
Current Estimated Value
Home Financials for this Owner
Home Financials are based on the most recent Mortgage that was taken out on this home.
Original Mortgage
$450,000
Outstanding Balance
$414,785
Interest Rate
3.12%
Mortgage Type
Commercial
Estimated Equity
-$338,118
Purchase Details
Closed on
Dec 29, 2021
Sold by
Riverside Property Invest Llc
Bought by
Hyp Llc
Home Financials for this Owner
Home Financials are based on the most recent Mortgage that was taken out on this home.
Original Mortgage
$450,000
Outstanding Balance
$414,785
Interest Rate
3.12%
Mortgage Type
Commercial
Estimated Equity
-$338,118
Purchase Details
Closed on
May 5, 2020
Sold by
The John M Newell Living Trust
Bought by
Riverside Property Invest Llc
Purchase Details
Closed on
Feb 26, 2019
Sold by
Newell John M
Bought by
Newell John M and The John M Newell Living Trust
Purchase Details
Closed on
Oct 1, 2001
Sold by
Heidenfelder Esther and Heidenfelder Ai W
Bought by
Newell John M
Home Financials for this Owner
Home Financials are based on the most recent Mortgage that was taken out on this home.
Original Mortgage
$23,400
Interest Rate
6.97%
Create a Home Valuation Report for This Property
The Home Valuation Report is an in-depth analysis detailing your home's value as well as a comparison with similar homes in the area
Home Values in the Area
Average Home Value in this Area
Purchase History
| Date | Buyer | Sale Price | Title Company |
|---|---|---|---|
| Sari Holdings Llc | $671,000 | Accent Title Inc | |
| Hyp Llc | $246,500 | Accent Title Inc | |
| Riverside Property Invest Llc | $45,000 | Accent Title Inc | |
| Newell John M | -- | Accent Title | |
| Newell John M | $26,000 | Metro East Title Corp |
Source: Public Records
Mortgage History
| Date | Status | Borrower | Loan Amount |
|---|---|---|---|
| Open | Sari Holdings Llc | $450,000 | |
| Previous Owner | Newell John M | $23,400 |
Source: Public Records
Tax History Compared to Growth
Tax History
| Year | Tax Paid | Tax Assessment Tax Assessment Total Assessment is a certain percentage of the fair market value that is determined by local assessors to be the total taxable value of land and additions on the property. | Land | Improvement |
|---|---|---|---|---|
| 2024 | $2,129 | $11,194 | $2,079 | $9,115 |
| 2023 | $1,923 | $10,117 | $1,879 | $8,238 |
| 2022 | $1,760 | $8,867 | $1,647 | $7,220 |
| 2021 | $1,804 | $8,403 | $1,561 | $6,842 |
| 2020 | $1,255 | $5,386 | $1,635 | $3,751 |
| 2019 | $1,257 | $5,386 | $1,635 | $3,751 |
| 2018 | $1,251 | $5,465 | $1,659 | $3,806 |
| 2017 | $1,458 | $5,333 | $1,619 | $3,714 |
| 2016 | $1,733 | $7,064 | $1,613 | $5,451 |
| 2014 | $1,429 | $6,987 | $1,595 | $5,392 |
| 2013 | $1,609 | $6,554 | $1,496 | $5,058 |
Source: Public Records
Map
Nearby Homes
- 1165 George St
- 1150 George St
- 227 Donald St
- 1157 Jones St
- 116 Saint Barbara Ln
- 114 Saint Barbara Ln
- 1120 Saint Michael Dr
- 706 Saint Barbara Ln
- 510 Saint Paul Dr
- 528 Saint Paul Dr
- 810 Saint Thomas Ln
- 404 Range Ln
- 808 Saint Thomas Ln
- 721 Saint Barbara Ln
- 1103 Saint Helena Dr
- 804 Saint Thomas Ln
- 803 Saint Thomas Ln
- 1132 St Stephen’s
- 725 Saint Nicholas Dr
- 815 Sparks Ave