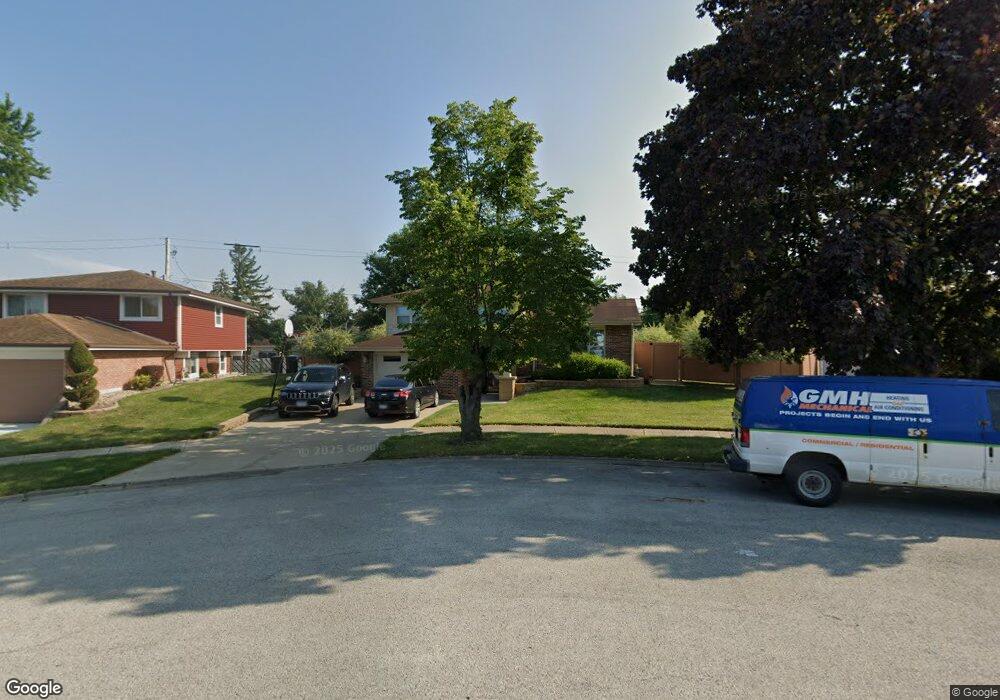
1159 E 168th Place South Holland, IL 60473
Central District NeighborhoodEstimated Value: $226,000 - $272,000
3
Beds
1
Bath
1,035
Sq Ft
$238/Sq Ft
Est. Value
About This Home
This home is located at 1159 E 168th Place, South Holland, IL 60473 and is currently estimated at $246,109, approximately $237 per square foot. 1159 E 168th Place is a home located in Cook County with nearby schools including Greenwood Elementary School, Mckinley Elementary School, and Mckinley Jr High School.
Ownership History
Date
Name
Owned For
Owner Type
Purchase Details
Closed on
Apr 16, 2024
Sold by
Warren Richard
Bought by
Bogan Jenae
Current Estimated Value
Home Financials for this Owner
Home Financials are based on the most recent Mortgage that was taken out on this home.
Original Mortgage
$232,800
Outstanding Balance
$228,978
Interest Rate
6.38%
Mortgage Type
New Conventional
Estimated Equity
$17,131
Purchase Details
Closed on
Jun 2, 2000
Sold by
Hud
Bought by
Warren Richard
Home Financials for this Owner
Home Financials are based on the most recent Mortgage that was taken out on this home.
Original Mortgage
$76,900
Interest Rate
8.24%
Purchase Details
Closed on
Nov 24, 1999
Sold by
Scott Jeremy M
Bought by
Hud
Purchase Details
Closed on
Jan 30, 1998
Sold by
Biegel George T and Biegel Diane F
Bought by
Scott Jeremy M and Dean Scott Tiffany J
Home Financials for this Owner
Home Financials are based on the most recent Mortgage that was taken out on this home.
Original Mortgage
$94,450
Interest Rate
7.08%
Mortgage Type
FHA
Create a Home Valuation Report for This Property
The Home Valuation Report is an in-depth analysis detailing your home's value as well as a comparison with similar homes in the area
Home Values in the Area
Average Home Value in this Area
Purchase History
| Date | Buyer | Sale Price | Title Company |
|---|---|---|---|
| Bogan Jenae | $240,000 | Chicago Title | |
| Warren Richard | -- | -- | |
| Hud | -- | -- | |
| Scott Jeremy M | $95,000 | -- |
Source: Public Records
Mortgage History
| Date | Status | Borrower | Loan Amount |
|---|---|---|---|
| Open | Bogan Jenae | $232,800 | |
| Previous Owner | Warren Richard | $76,900 | |
| Previous Owner | Scott Jeremy M | $94,450 |
Source: Public Records
Tax History Compared to Growth
Tax History
| Year | Tax Paid | Tax Assessment Tax Assessment Total Assessment is a certain percentage of the fair market value that is determined by local assessors to be the total taxable value of land and additions on the property. | Land | Improvement |
|---|---|---|---|---|
| 2024 | $7,211 | $19,001 | $4,043 | $14,958 |
| 2023 | $6,083 | $19,001 | $4,043 | $14,958 |
| 2022 | $6,083 | $13,728 | $3,491 | $10,237 |
| 2021 | $5,893 | $13,728 | $3,491 | $10,237 |
| 2020 | $5,680 | $13,728 | $3,491 | $10,237 |
| 2019 | $3,971 | $10,703 | $2,940 | $7,763 |
| 2018 | $3,788 | $10,703 | $2,940 | $7,763 |
| 2017 | $3,734 | $10,703 | $2,940 | $7,763 |
| 2016 | $4,057 | $10,670 | $2,756 | $7,914 |
| 2015 | $3,866 | $10,670 | $2,756 | $7,914 |
| 2014 | $3,796 | $10,670 | $2,756 | $7,914 |
| 2013 | $3,555 | $10,850 | $2,756 | $8,094 |
Source: Public Records
Map
Nearby Homes
- 1158 E 169th St
- 1320 E 169th Place
- 17006 University Ave
- 16656 Woodlawn East Ct
- 17032 University Ave
- 1243 E 166th Place
- 947 E 169th St
- 16921 Ingleside Ave
- 16639 Dobson Ave
- 949 E 170th St
- 16617 Kimbark Ave
- 17120 University Ave
- 17129 Greenwood Ave
- 1238 E 166th St
- 1229 E 165th Place
- 16560 Greenwood Ave
- 811 E 169th Place
- 16465 Woodlawn East Ave
- 16664 Maryland Ave
- 16646 Maryland Ave
- 16840 Woodlawn East Ave
- 1165 E 168th Place
- 1164 E 169th St
- 1152 E 169th St
- 1202 E 169th St
- 16830 Woodlawn East Ave
- 1144 E 169th St
- 16844 Avalon Ave
- 16847 University Ave
- 16839 University Ave
- 1200 E 168th Place
- 16856 Avalon Ave
- 16820 Woodlawn East Ave
- 16857 University Ave
- 16901 Woodlawn East Ave
- 16833 University Ave
- 16810 Woodlawn Ave E
- 1201 E 168th St
- 16810 Woodlawn East Ave
- 1207 E 169th St