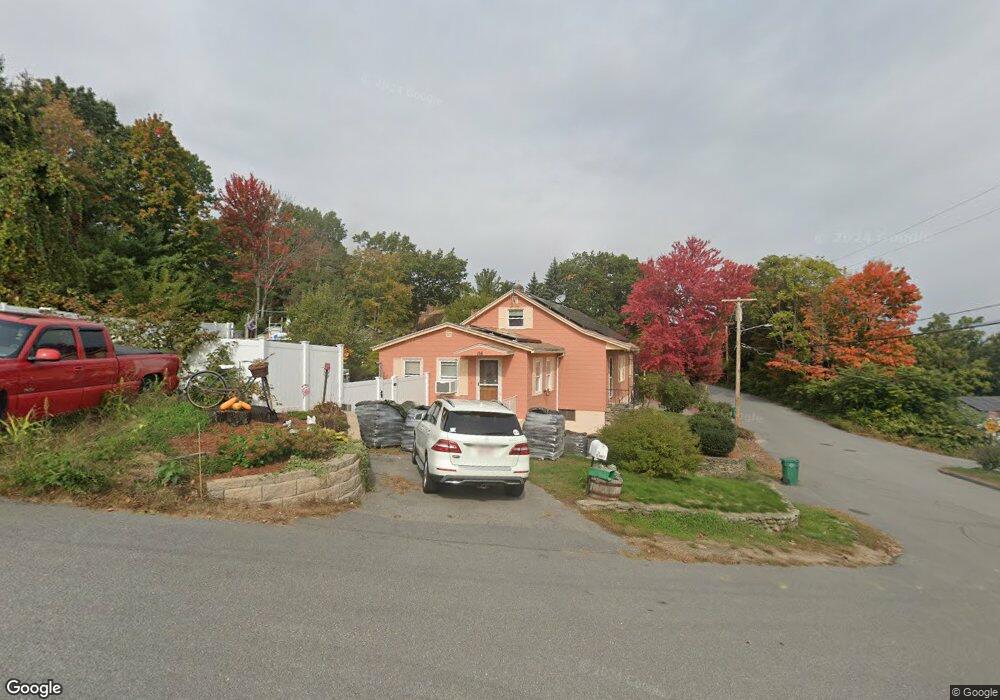
116 Belmont St Fitchburg, MA 01420
South Fitchburg NeighborhoodEstimated Value: $401,206 - $452,000
3
Beds
1
Bath
1,456
Sq Ft
$289/Sq Ft
Est. Value
About This Home
This home is located at 116 Belmont St, Fitchburg, MA 01420 and is currently estimated at $420,302, approximately $288 per square foot. 116 Belmont St is a home located in Worcester County with nearby schools including South Street Elementary School, Reingold Elementary School, and Crocker Elementary School.
Ownership History
Date
Name
Owned For
Owner Type
Purchase Details
Closed on
Mar 18, 1994
Sold by
Fhlmc
Bought by
Brousseau Michael E and Brousseau Linda May
Current Estimated Value
Home Financials for this Owner
Home Financials are based on the most recent Mortgage that was taken out on this home.
Original Mortgage
$86,850
Interest Rate
6.9%
Mortgage Type
Purchase Money Mortgage
Purchase Details
Closed on
Feb 15, 1994
Sold by
Burke Leon G and Federal Home Loan Mortgage Corporation
Bought by
Fhlmc
Home Financials for this Owner
Home Financials are based on the most recent Mortgage that was taken out on this home.
Original Mortgage
$86,850
Interest Rate
6.9%
Mortgage Type
Purchase Money Mortgage
Create a Home Valuation Report for This Property
The Home Valuation Report is an in-depth analysis detailing your home's value as well as a comparison with similar homes in the area
Home Values in the Area
Average Home Value in this Area
Purchase History
| Date | Buyer | Sale Price | Title Company |
|---|---|---|---|
| Brousseau Michael E | $87,000 | -- | |
| Fhlmc | $99,900 | -- |
Source: Public Records
Mortgage History
| Date | Status | Borrower | Loan Amount |
|---|---|---|---|
| Open | Fhlmc | $123,750 | |
| Closed | Fhlmc | $86,850 | |
| Previous Owner | Fhlmc | $10,648 | |
| Previous Owner | Fhlmc | $103,500 |
Source: Public Records
Tax History Compared to Growth
Tax History
| Year | Tax Paid | Tax Assessment Tax Assessment Total Assessment is a certain percentage of the fair market value that is determined by local assessors to be the total taxable value of land and additions on the property. | Land | Improvement |
|---|---|---|---|---|
| 2025 | $44 | $326,200 | $108,400 | $217,800 |
| 2024 | $4,698 | $317,200 | $80,800 | $236,400 |
| 2023 | $4,498 | $280,800 | $71,400 | $209,400 |
| 2022 | $3,874 | $220,000 | $56,600 | $163,400 |
| 2021 | $7,133 | $202,100 | $45,800 | $156,300 |
| 2020 | $3,763 | $190,900 | $43,100 | $147,800 |
| 2019 | $3,198 | $174,300 | $56,600 | $117,700 |
| 2018 | $3,402 | $161,900 | $52,500 | $109,400 |
| 2017 | $2,956 | $143,300 | $52,500 | $90,800 |
| 2016 | $2,962 | $139,500 | $49,800 | $89,700 |
| 2015 | $2,856 | $138,100 | $48,500 | $89,600 |
| 2014 | $2,748 | $138,600 | $48,500 | $90,100 |
Source: Public Records
Map
Nearby Homes
- 19 Mount Carmel St
- 156 Belmont St
- 55 Canton St
- 43 Saint Anthony St
- 505 Old St S
- 535 South St Unit 4-2A
- 535 South St Unit 14-2A
- 55 Smith St
- 11 Doane St
- 62 Hancock St
- 53-55 Marion St
- 38-44 Granite St
- 19 Boylston St
- 20 Clyde St
- 15 Clyde St
- 48 Woodworth Ave
- 2 Arden Mills Way Unit 2210
- 6 Boylston St
- 25 Railroad St
- 37 Putnam Park
- 11 Mount Carmel St
- 100 Belmont St
- 124 Belmont St
- 115 Belmont St
- 18 Mount Carmel St
- 15 Capone St
- 86 Belmont St
- 125 Belmont St
- 136 Belmont St
- 12 Capone St
- 31 Mount Carmel St
- 34 Mount Carmel St
- 135 Belmont St
- 144 Belmont St
- 106 Canton St
- 81 Belmont St
- 132 Canton St
- 102 Canton St
- 145 Belmont St
- 0 St Peter St Unit 30156511