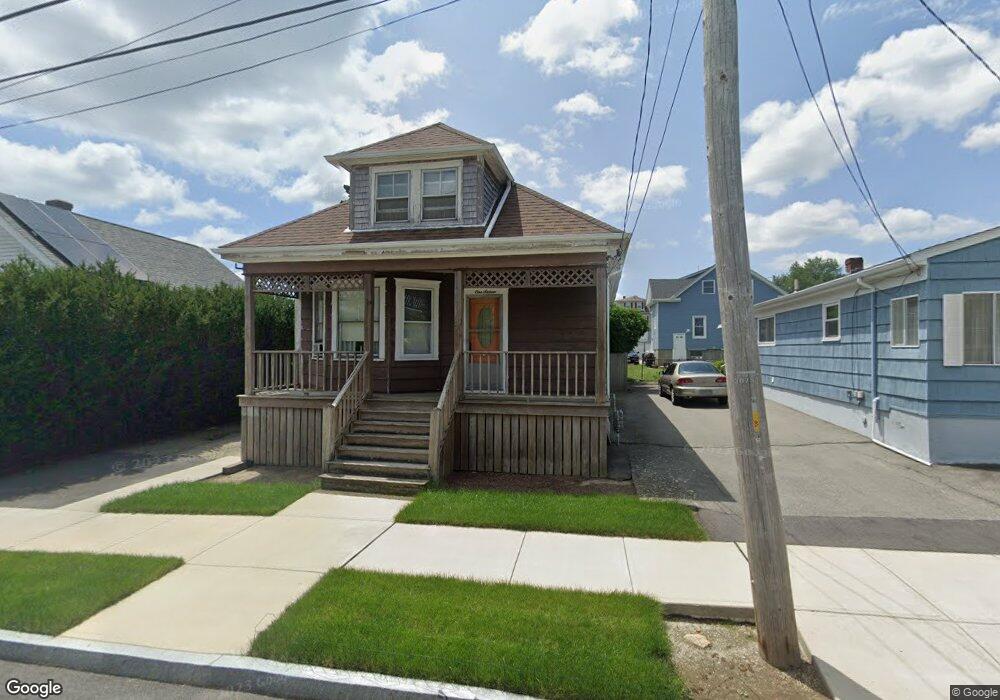
116 Frank St South Dartmouth, MA 02748
The South End NeighborhoodEstimated Value: $407,000 - $471,000
3
Beds
3
Baths
1,359
Sq Ft
$323/Sq Ft
Est. Value
About This Home
This home is located at 116 Frank St, South Dartmouth, MA 02748 and is currently estimated at $439,378, approximately $323 per square foot. 116 Frank St is a home located in Bristol County with nearby schools including John B. DeValles Elementary School, Roosevelt Middle School, and New Bedford High School.
Ownership History
Date
Name
Owned For
Owner Type
Purchase Details
Closed on
Aug 2, 2018
Sold by
Allison Bertha and Allison Brian E
Bought by
Allison Brian E and Allison Bertha
Current Estimated Value
Purchase Details
Closed on
Oct 14, 2015
Sold by
Allison Bertha
Bought by
Allison Bertha and Allison Brian E
Purchase Details
Closed on
Jan 16, 1974
Bought by
Allison Bertha
Create a Home Valuation Report for This Property
The Home Valuation Report is an in-depth analysis detailing your home's value as well as a comparison with similar homes in the area
Home Values in the Area
Average Home Value in this Area
Purchase History
| Date | Buyer | Sale Price | Title Company |
|---|---|---|---|
| Allison Brian E | -- | -- | |
| Allison Bertha | -- | -- | |
| Allison Bertha | -- | -- |
Source: Public Records
Mortgage History
| Date | Status | Borrower | Loan Amount |
|---|---|---|---|
| Previous Owner | Allison Bertha | $35,750 | |
| Previous Owner | Allison Bertha | $20,000 |
Source: Public Records
Tax History Compared to Growth
Tax History
| Year | Tax Paid | Tax Assessment Tax Assessment Total Assessment is a certain percentage of the fair market value that is determined by local assessors to be the total taxable value of land and additions on the property. | Land | Improvement |
|---|---|---|---|---|
| 2025 | $2,569 | $298,400 | $106,800 | $191,600 |
| 2024 | $2,451 | $282,000 | $106,800 | $175,200 |
| 2023 | $2,415 | $263,400 | $106,800 | $156,600 |
| 2022 | $2,359 | $238,300 | $106,800 | $131,500 |
| 2021 | $2,026 | $195,600 | $103,700 | $91,900 |
| 2020 | $1,800 | $173,400 | $87,800 | $85,600 |
| 2019 | $1,767 | $169,900 | $82,600 | $87,300 |
| 2018 | $1,653 | $163,500 | $84,700 | $78,800 |
| 2017 | $1,579 | $157,600 | $79,900 | $77,700 |
| 2016 | $1,582 | $155,700 | $81,900 | $73,800 |
| 2015 | $1,491 | $147,000 | $71,900 | $75,100 |
| 2014 | $1,489 | $145,800 | $72,100 | $73,700 |
Source: Public Records
Map
Nearby Homes