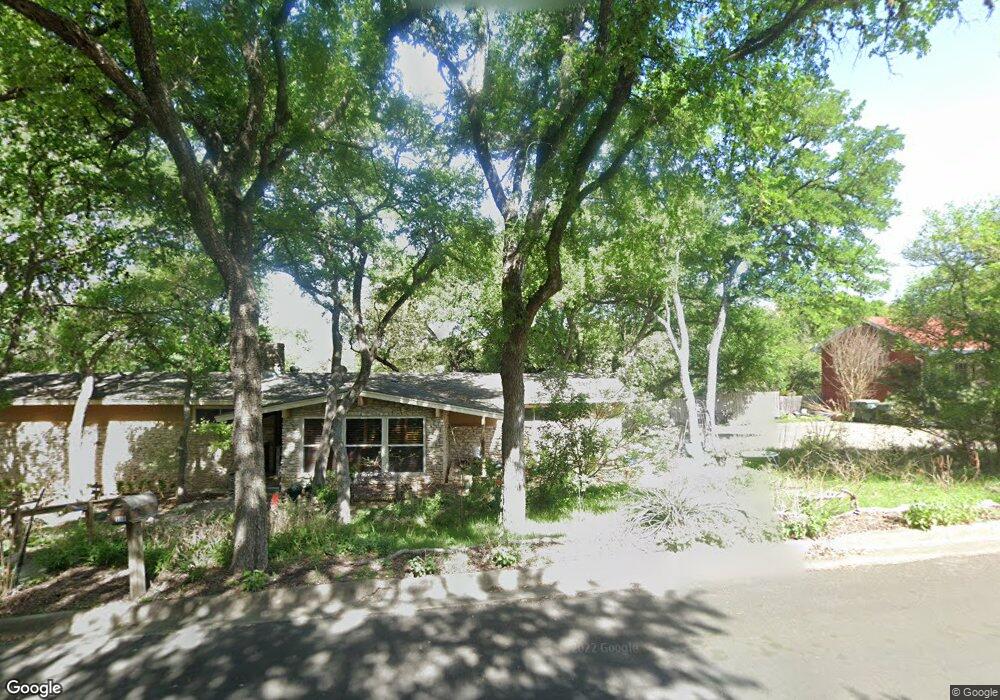
116 Nichols Dr San Marcos, TX 78666
Estimated Value: $315,998 - $364,000
--
Bed
--
Bath
1,652
Sq Ft
$212/Sq Ft
Est. Value
About This Home
This home is located at 116 Nichols Dr, San Marcos, TX 78666 and is currently estimated at $350,250, approximately $212 per square foot. 116 Nichols Dr is a home located in Hays County with nearby schools including Crockett Elementary School, Dorris Miller Middle School, and San Marcos High School.
Ownership History
Date
Name
Owned For
Owner Type
Purchase Details
Closed on
Feb 28, 2024
Sold by
Quittner Andrew L and Quittner Kay A
Bought by
Keeney Courtney and Keeney Hunter
Current Estimated Value
Home Financials for this Owner
Home Financials are based on the most recent Mortgage that was taken out on this home.
Original Mortgage
$410,815
Outstanding Balance
$403,137
Interest Rate
6.6%
Mortgage Type
FHA
Estimated Equity
-$52,887
Purchase Details
Closed on
Nov 18, 2005
Sold by
Nell Laura J
Bought by
Quittner Andrew L and Quittner Kay A
Home Financials for this Owner
Home Financials are based on the most recent Mortgage that was taken out on this home.
Original Mortgage
$26,775
Interest Rate
6.06%
Mortgage Type
Stand Alone Second
Purchase Details
Closed on
Nov 1, 1992
Sold by
Crawford James
Bought by
Quittner Andrew L and Quittner Kay A
Create a Home Valuation Report for This Property
The Home Valuation Report is an in-depth analysis detailing your home's value as well as a comparison with similar homes in the area
Home Values in the Area
Average Home Value in this Area
Purchase History
| Date | Buyer | Sale Price | Title Company |
|---|---|---|---|
| Keeney Courtney | -- | Corridor Title | |
| Quittner Andrew L | -- | Fnt | |
| Quittner Andrew L | -- | -- |
Source: Public Records
Mortgage History
| Date | Status | Borrower | Loan Amount |
|---|---|---|---|
| Open | Keeney Courtney | $410,815 | |
| Previous Owner | Quittner Andrew L | $26,775 | |
| Previous Owner | Quittner Andrew L | $142,800 |
Source: Public Records
Tax History Compared to Growth
Tax History
| Year | Tax Paid | Tax Assessment Tax Assessment Total Assessment is a certain percentage of the fair market value that is determined by local assessors to be the total taxable value of land and additions on the property. | Land | Improvement |
|---|---|---|---|---|
| 2025 | $2,892 | $368,600 | $102,680 | $265,920 |
| 2024 | $2,892 | $374,050 | $102,680 | $271,370 |
| 2023 | $6,734 | $354,070 | $102,680 | $287,110 |
| 2022 | $6,596 | $321,882 | $92,040 | $275,320 |
| 2021 | $6,450 | $292,620 | $66,940 | $225,680 |
| 2020 | $4,080 | $269,806 | $59,570 | $210,550 |
| 2019 | $6,038 | $245,278 | $59,570 | $200,570 |
| 2018 | $5,682 | $229,779 | $51,840 | $186,720 |
| 2017 | $5,022 | $208,890 | $29,810 | $179,080 |
| 2016 | $4,734 | $196,880 | $29,810 | $167,070 |
| 2015 | $3,586 | $196,390 | $29,810 | $166,580 |
Source: Public Records
Map
Nearby Homes
- 71 Elm Hill Ct
- 2 Tanglewood Trail
- 103 Sierra Ridge Dr
- 118 Yaupon Ct
- 903 Sagewood Trail Unit 905
- 806 Sagewood Trail Unit 808
- 105 Yaupon Ct
- 211 Ridgewood Dr
- 206 Yale St
- 1013 Chestnut St
- 1013 Chestnut St Unit 6
- 1013 Chestnut St Unit Building C, Unit 5
- 1013 Chestnut St Unit 4
- 135 Eastwood Ln
- 205 Hughson Dr
- 114 Algarita St
- 0 Old Ranch Road 12
- 140 Coers Dr
- 905 N Lbj Dr
- 1102 Academy St
- 124 Nichols Dr
- 112 Nichols Dr
- 119 Nichols Dr
- 123 Nichols Dr
- 11 Tanglewood St
- 128 Nichols Dr
- 108 Nichols Dr
- 115 Nichols Dr
- 127 Nichols Dr
- 15 Tanglewood St
- 111 Nichols Dr
- 131 Nichols Dr
- 104 Nichols Dr
- 67 Elm Hill Ct
- 75 Elm Hill Ct
- 79 Elm Hill Ct
- 7 Tanglewood St
- 107 Nichols Dr
- 1444 Highland Dr
- 83 Elm Hill Ct