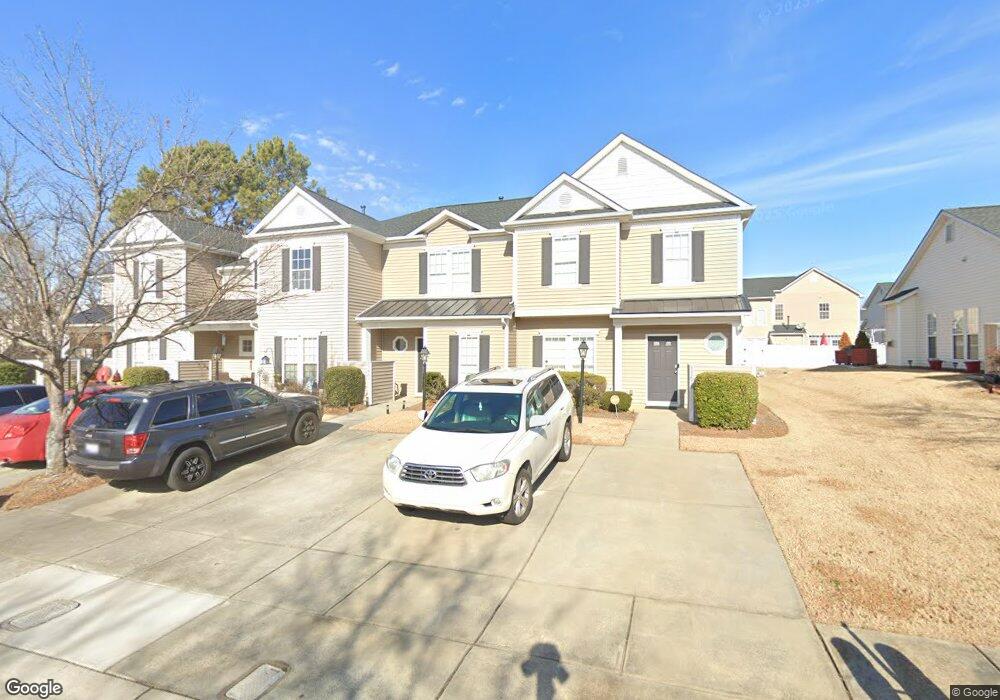
11642 Lioness St Charlotte, NC 28273
Yorkshire NeighborhoodEstimated Value: $248,000 - $285,245
3
Beds
3
Baths
1,518
Sq Ft
$177/Sq Ft
Est. Value
About This Home
This home is located at 11642 Lioness St, Charlotte, NC 28273 and is currently estimated at $268,561, approximately $176 per square foot. 11642 Lioness St is a home located in Mecklenburg County with nearby schools including Lake Wylie Elementary School, Southwest Middle School, and Unity Classical Charter School.
Ownership History
Date
Name
Owned For
Owner Type
Purchase Details
Closed on
Sep 23, 2020
Sold by
Whitmire Derek and Whitmire Sarah
Bought by
Blackmon Latia
Current Estimated Value
Home Financials for this Owner
Home Financials are based on the most recent Mortgage that was taken out on this home.
Original Mortgage
$154,000
Outstanding Balance
$136,665
Interest Rate
2.9%
Mortgage Type
New Conventional
Estimated Equity
$131,896
Purchase Details
Closed on
Mar 7, 2008
Sold by
Martin Heather B and Martin Jeremy
Bought by
Whitmire Derek
Home Financials for this Owner
Home Financials are based on the most recent Mortgage that was taken out on this home.
Original Mortgage
$118,000
Interest Rate
5.46%
Mortgage Type
Purchase Money Mortgage
Purchase Details
Closed on
May 12, 2004
Sold by
Mulvaney Homes Inc
Bought by
Baucom Heather C
Home Financials for this Owner
Home Financials are based on the most recent Mortgage that was taken out on this home.
Original Mortgage
$108,858
Interest Rate
5.49%
Mortgage Type
FHA
Create a Home Valuation Report for This Property
The Home Valuation Report is an in-depth analysis detailing your home's value as well as a comparison with similar homes in the area
Home Values in the Area
Average Home Value in this Area
Purchase History
| Date | Buyer | Sale Price | Title Company |
|---|---|---|---|
| Blackmon Latia | $154,000 | None Available | |
| Whitmire Derek | $118,000 | Attorneys Title | |
| Baucom Heather C | $110,000 | -- |
Source: Public Records
Mortgage History
| Date | Status | Borrower | Loan Amount |
|---|---|---|---|
| Open | Blackmon Latia | $154,000 | |
| Previous Owner | Whitmire Derek | $118,000 | |
| Previous Owner | Baucom Heather C | $108,858 |
Source: Public Records
Tax History Compared to Growth
Tax History
| Year | Tax Paid | Tax Assessment Tax Assessment Total Assessment is a certain percentage of the fair market value that is determined by local assessors to be the total taxable value of land and additions on the property. | Land | Improvement |
|---|---|---|---|---|
| 2025 | $2,257 | $277,800 | $60,000 | $217,800 |
| 2024 | $2,257 | $277,800 | $60,000 | $217,800 |
| 2023 | $2,177 | $277,800 | $60,000 | $217,800 |
| 2022 | $1,677 | $160,800 | $45,000 | $115,800 |
| 2021 | $1,666 | $160,800 | $45,000 | $115,800 |
| 2020 | $1,659 | $160,800 | $45,000 | $115,800 |
| 2019 | $1,643 | $160,800 | $45,000 | $115,800 |
| 2018 | $1,442 | $104,300 | $15,000 | $89,300 |
| 2017 | $1,413 | $104,300 | $15,000 | $89,300 |
| 2016 | $1,404 | $104,300 | $15,000 | $89,300 |
| 2015 | $1,392 | $104,300 | $15,000 | $89,300 |
| 2014 | $1,379 | $104,300 | $15,000 | $89,300 |
Source: Public Records
Map
Nearby Homes
- 14722 Lions Pride Ct
- 11548 Savannah Creek Dr
- 13332 Savannah Club Dr
- 11521 Savannah Creek Dr
- 13310 Erwin Rd
- 14640 Lions Paw St
- 14755 Lions Paw St
- 12039 Windy Rock Way
- 13116 Erwin Rd
- 12308 Verdant Ct Unit 10D
- 12408 Savannah Cottage Dr
- 13443 Kibworth Ln
- 15005 Savannah Hall Dr Unit Lot 72
- 11628 Eastwind Dr
- 11314 Bumpious Ct
- 11320 Wagonford Ln
- 10867 Garden Oaks Ln
- 13421 Bolingbrook Ln
- 13308 Bolingbrook Ln
- 11440 Laurel View Dr
- 11638 Lioness St
- 11646 Lioness St
- 11634 Lioness St
- 11650 Lioness St
- 11630 Lioness St
- 11626 Lioness St
- 14726 Lions Pride Ct
- 14730 Lions Pride Ct
- 14718 Lions Pride Ct Unit C
- 14734 Lions Pride Ct
- 14714 Lions Pride Ct
- 14738 Lions Pride Ct
- 11643 Lioness St
- 11639 Lioness St
- 11654 Lioness St
- 14742 Lions Pride Ct Unit 9
- 14742 Lions Pride Ct
- 11647 Lioness St
- 11635 Lioness St
- 14710 Lions Pride Ct Unit D