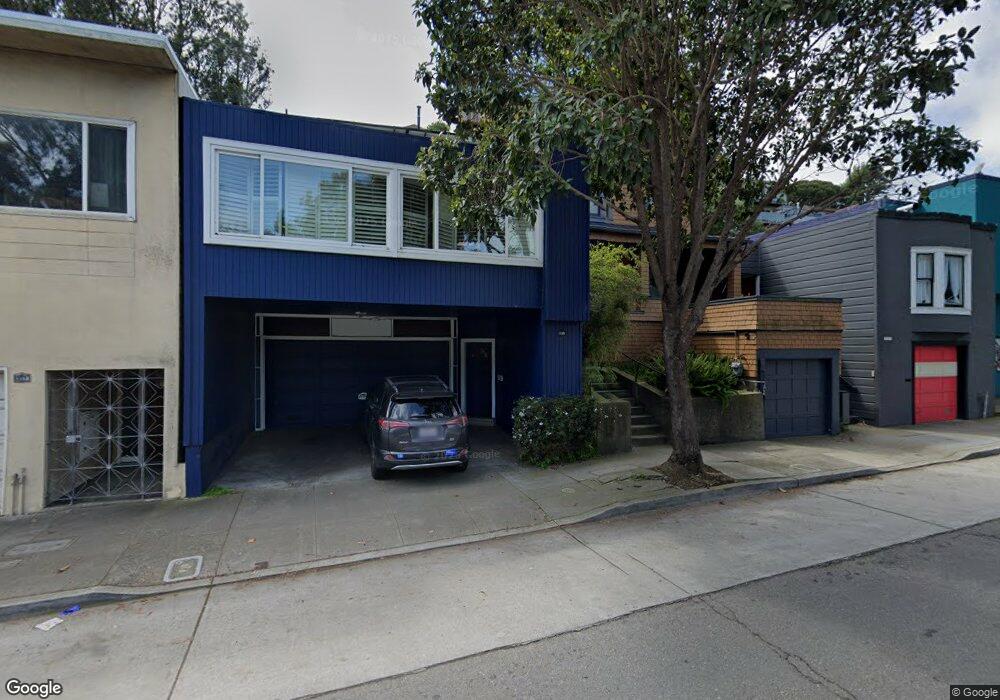
1165 Bosworth St San Francisco, CA 94131
Glen Park NeighborhoodEstimated Value: $1,376,000 - $2,088,000
3
Beds
3
Baths
1,608
Sq Ft
$1,069/Sq Ft
Est. Value
About This Home
This home is located at 1165 Bosworth St, San Francisco, CA 94131 and is currently estimated at $1,718,707, approximately $1,068 per square foot. 1165 Bosworth St is a home located in San Francisco County with nearby schools including Glen Park Elementary School, James Lick Middle School, and Leadership High School.
Ownership History
Date
Name
Owned For
Owner Type
Purchase Details
Closed on
Sep 16, 2003
Sold by
Patten James J and Nayer Louise B
Bought by
Patten James J and Nayer Louise B
Current Estimated Value
Purchase Details
Closed on
Dec 2, 1996
Sold by
Carmen T Perez Family Trust and Carmen T
Bought by
Patten James J and Nayer Louise Bedford
Home Financials for this Owner
Home Financials are based on the most recent Mortgage that was taken out on this home.
Original Mortgage
$207,000
Interest Rate
7.86%
Create a Home Valuation Report for This Property
The Home Valuation Report is an in-depth analysis detailing your home's value as well as a comparison with similar homes in the area
Home Values in the Area
Average Home Value in this Area
Purchase History
| Date | Buyer | Sale Price | Title Company |
|---|---|---|---|
| Patten James J | -- | -- | |
| Patten James J | -- | -- | |
| Patten James J | $303,000 | Fidelity National Title Co |
Source: Public Records
Mortgage History
| Date | Status | Borrower | Loan Amount |
|---|---|---|---|
| Previous Owner | Patten James J | $207,000 |
Source: Public Records
Tax History Compared to Growth
Tax History
| Year | Tax Paid | Tax Assessment Tax Assessment Total Assessment is a certain percentage of the fair market value that is determined by local assessors to be the total taxable value of land and additions on the property. | Land | Improvement |
|---|---|---|---|---|
| 2025 | $6,375 | $495,405 | $342,012 | $151,454 |
| 2024 | $6,375 | $483,791 | $335,306 | $148,485 |
| 2023 | $6,269 | $474,306 | $328,732 | $145,574 |
| 2022 | $6,136 | $465,007 | $322,287 | $142,720 |
| 2021 | $6,022 | $455,890 | $315,968 | $139,922 |
| 2020 | $6,064 | $451,217 | $312,729 | $138,488 |
| 2019 | $5,858 | $442,371 | $306,598 | $135,773 |
| 2018 | $5,661 | $433,698 | $300,587 | $133,111 |
| 2017 | $5,294 | $425,195 | $294,694 | $130,501 |
| 2016 | $5,185 | $416,859 | $288,916 | $127,943 |
| 2015 | $5,118 | $410,599 | $284,577 | $126,022 |
| 2014 | $4,983 | $402,557 | $279,003 | $123,554 |
Source: Public Records
Map
Nearby Homes
- 25 Mizpah St
- 222 Monterey Blvd
- 47 Melrose Ave
- 58 Monterey Blvd
- 54-56 Monterey Blvd
- 169 Brompton Ave
- 2608 Diamond St
- 408 Gold Mine Dr
- 43 Sussex St
- 471 Joost Ave
- 101 Moffitt St
- 225 Cotter St
- 335 Hearst Ave
- 95 Ora Way Unit 303F
- 338 Marietta Dr
- 200 Cayuga Ave
- 246 Bemis St
- 258 Flood Ave
- 85 Ora Way Unit 308E
- 538 Joost Ave