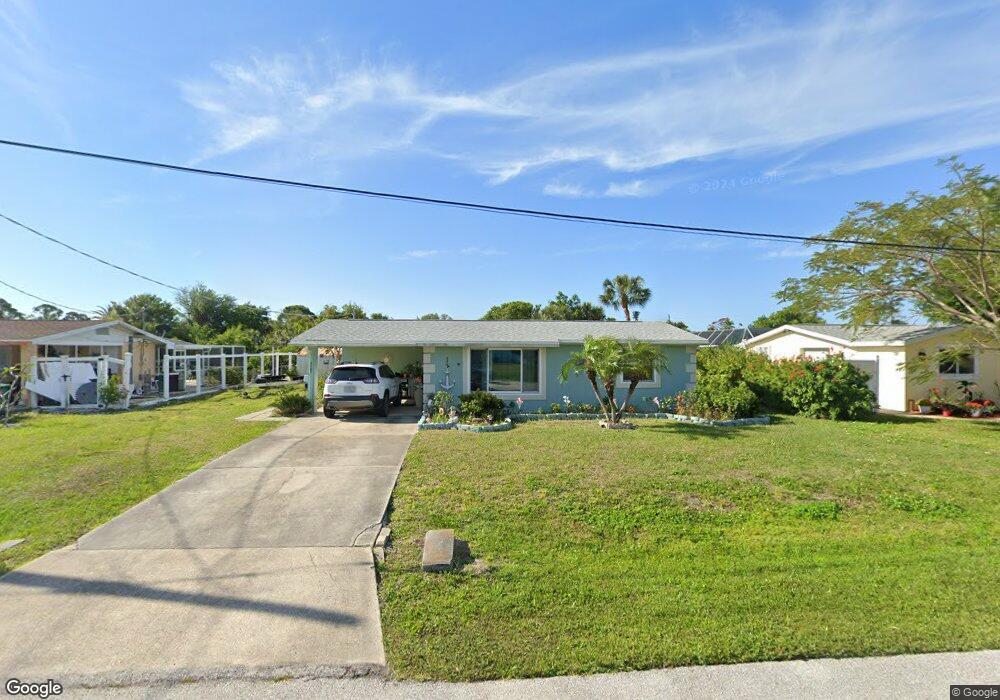
1167 Clark St Englewood, FL 34224
Englewood South NeighborhoodEstimated Value: $242,000 - $290,000
3
Beds
1
Bath
936
Sq Ft
$274/Sq Ft
Est. Value
About This Home
This home is located at 1167 Clark St, Englewood, FL 34224 and is currently estimated at $256,123, approximately $273 per square foot. 1167 Clark St is a home located in Charlotte County with nearby schools including Myakka River Elementary School, L.A. Ainger Middle School, and Lemon Bay High School.
Ownership History
Date
Name
Owned For
Owner Type
Purchase Details
Closed on
Apr 13, 2023
Sold by
Mensing Gary and Mensing Pamela Yvette
Bought by
Mensing Gary and Mensing Gary
Current Estimated Value
Purchase Details
Closed on
Feb 15, 2021
Sold by
Merritt Charles Floyd and Merritt Joeline
Bought by
Mensing Pamela Yvette and Mensing Gary
Purchase Details
Closed on
Jul 1, 1997
Sold by
Wuestefeld Willy
Bought by
Merritt Charles F and Merritt Joeline
Home Financials for this Owner
Home Financials are based on the most recent Mortgage that was taken out on this home.
Original Mortgage
$46,400
Interest Rate
7.92%
Create a Home Valuation Report for This Property
The Home Valuation Report is an in-depth analysis detailing your home's value as well as a comparison with similar homes in the area
Home Values in the Area
Average Home Value in this Area
Purchase History
| Date | Buyer | Sale Price | Title Company |
|---|---|---|---|
| Mensing Gary | $100 | None Listed On Document | |
| Mensing Pamela Yvette | $140,000 | Attorney | |
| Merritt Charles F | -- | -- |
Source: Public Records
Mortgage History
| Date | Status | Borrower | Loan Amount |
|---|---|---|---|
| Previous Owner | Merritt Charles F | $46,400 |
Source: Public Records
Tax History Compared to Growth
Tax History
| Year | Tax Paid | Tax Assessment Tax Assessment Total Assessment is a certain percentage of the fair market value that is determined by local assessors to be the total taxable value of land and additions on the property. | Land | Improvement |
|---|---|---|---|---|
| 2023 | $1,584 | $93,188 | $0 | $0 |
| 2022 | $1,511 | $90,474 | $0 | $0 |
| 2021 | $1,689 | $100,521 | $0 | $0 |
| 2020 | $1,653 | $99,133 | $0 | $0 |
| 2019 | $1,564 | $96,904 | $0 | $0 |
| 2018 | $1,425 | $95,097 | $0 | $0 |
| 2017 | $1,403 | $93,141 | $0 | $0 |
| 2016 | $1,260 | $91,225 | $0 | $0 |
| 2015 | $1,238 | $90,591 | $0 | $0 |
| 2014 | $1,207 | $89,872 | $0 | $0 |
Source: Public Records
Map
Nearby Homes