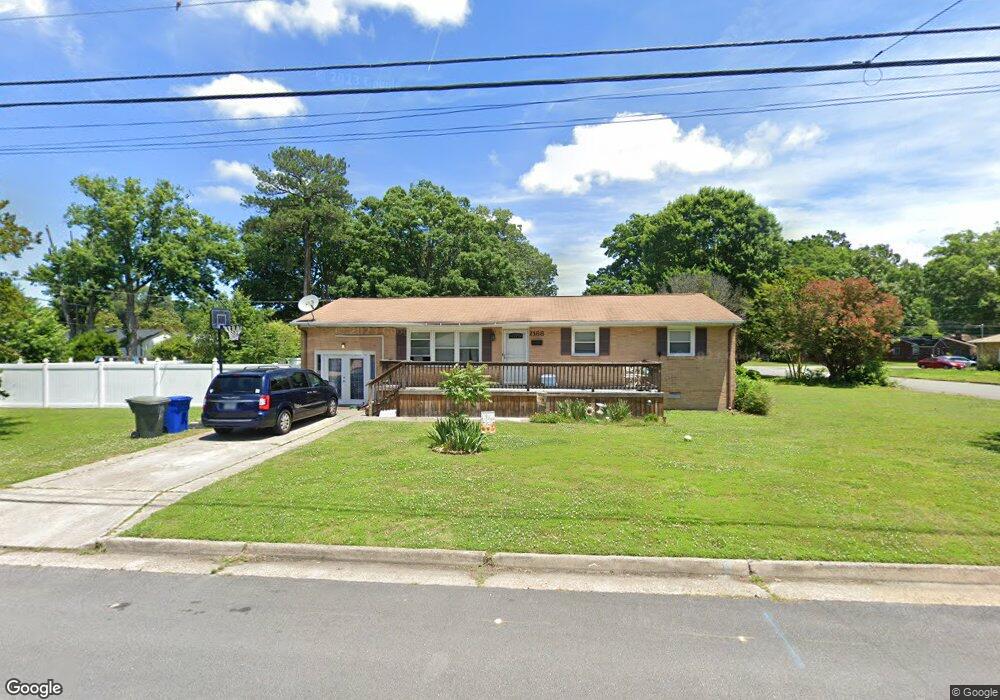
1168 Tyler Ave Newport News, VA 23601
Green Oaks NeighborhoodEstimated Value: $204,000 - $258,000
4
Beds
3
Baths
1,393
Sq Ft
$169/Sq Ft
Est. Value
About This Home
This home is located at 1168 Tyler Ave, Newport News, VA 23601 and is currently estimated at $235,157, approximately $168 per square foot. 1168 Tyler Ave is a home located in Newport News City with nearby schools including Sedgefield Elementary School, Homer L. Hines Middle School, and Warwick High School.
Ownership History
Date
Name
Owned For
Owner Type
Purchase Details
Closed on
Mar 17, 2006
Sold by
Taylor Michael S
Bought by
Brown Kenneth T
Current Estimated Value
Home Financials for this Owner
Home Financials are based on the most recent Mortgage that was taken out on this home.
Original Mortgage
$27,000
Interest Rate
5.95%
Mortgage Type
Stand Alone Second
Create a Home Valuation Report for This Property
The Home Valuation Report is an in-depth analysis detailing your home's value as well as a comparison with similar homes in the area
Home Values in the Area
Average Home Value in this Area
Purchase History
| Date | Buyer | Sale Price | Title Company |
|---|---|---|---|
| Brown Kenneth T | $135,000 | -- |
Source: Public Records
Mortgage History
| Date | Status | Borrower | Loan Amount |
|---|---|---|---|
| Closed | Brown Kenneth T | $27,000 | |
| Open | Brown Kenneth T | $108,000 |
Source: Public Records
Tax History Compared to Growth
Tax History
| Year | Tax Paid | Tax Assessment Tax Assessment Total Assessment is a certain percentage of the fair market value that is determined by local assessors to be the total taxable value of land and additions on the property. | Land | Improvement |
|---|---|---|---|---|
| 2024 | $2,548 | $215,900 | $60,500 | $155,400 |
| 2023 | $2,559 | $204,400 | $60,500 | $143,900 |
| 2022 | $2,379 | $186,000 | $60,500 | $125,500 |
| 2021 | $1,967 | $161,200 | $55,000 | $106,200 |
| 2020 | $1,983 | $150,500 | $55,000 | $95,500 |
| 2019 | $1,944 | $147,700 | $55,000 | $92,700 |
| 2018 | $1,941 | $147,700 | $55,000 | $92,700 |
| 2017 | $1,857 | $140,800 | $55,000 | $85,800 |
| 2016 | $1,853 | $140,800 | $55,000 | $85,800 |
| 2015 | $1,902 | $145,300 | $55,000 | $90,300 |
| 2014 | $1,646 | $145,300 | $55,000 | $90,300 |
Source: Public Records
Map
Nearby Homes